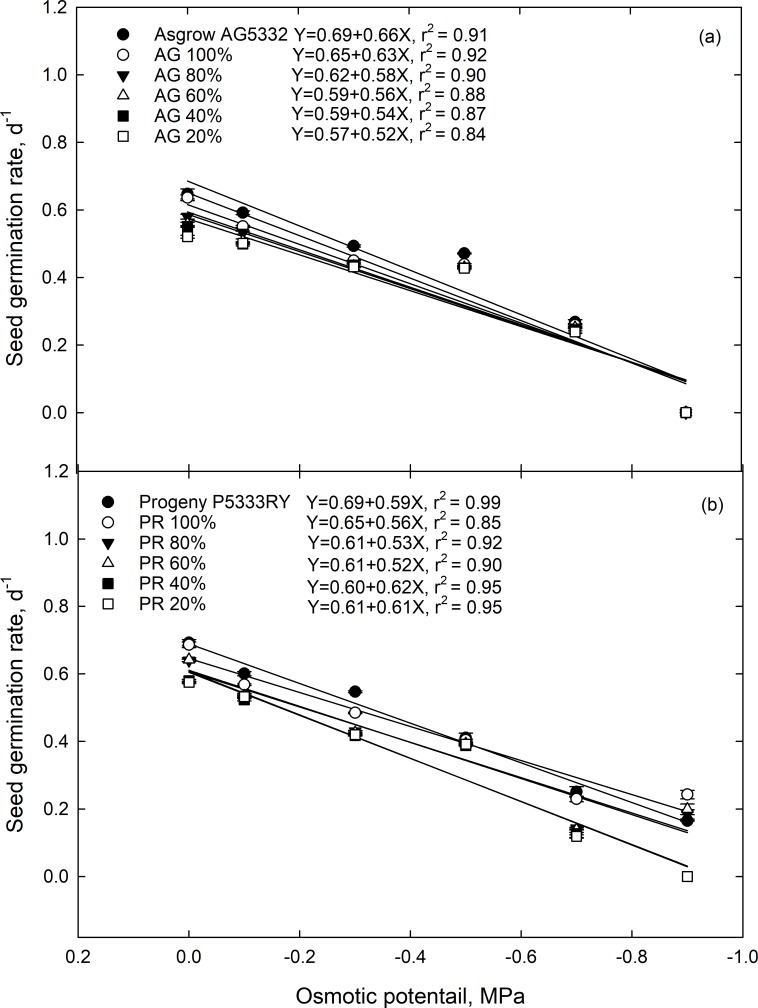
Fig 4. The germination rate of soybean seed from the F1 generation as a function of osmotic potential.
F1 seed was collected from the soybean cultivar (a) Asgrow AG5332 and (b) Progeny P5333RY after exposure to drought stress including replacement of 100, 80, 60, 40, and 20% of the evapotranspiration demand. Symbols represent the mean of four replications, while bars represent the standard error. Lines are the best fit of a quadratic function.

