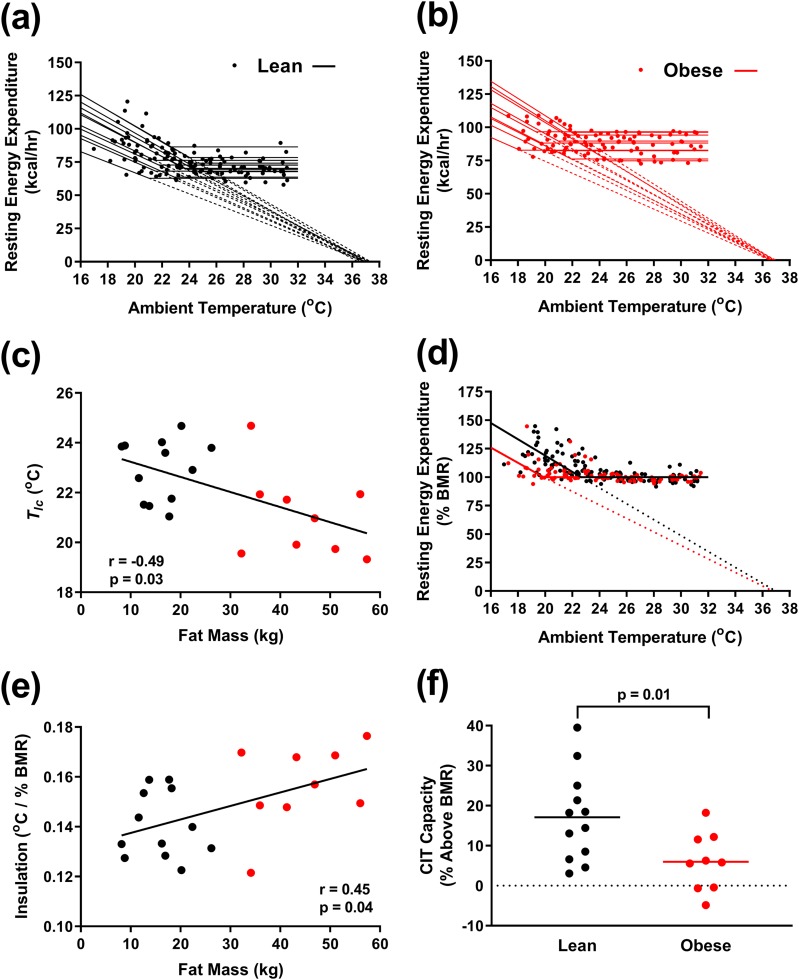
Figure 2.
Analysis of resting EE vs Ta. (a and b) Resting EE as a function of Ta with individual Scholander model fits for (a) 12 lean men (black) and (b) 9 men with obesity (red). (c) Tlc inversely correlates with fat mass. (d) Resting EE normalized to BMR as a function of Ta. (e) Insulation positively correlates with fat mass. (f) CIT capacity, the resting EE at the coldest tolerable temperature, is greater in lean men than men with obesity.

