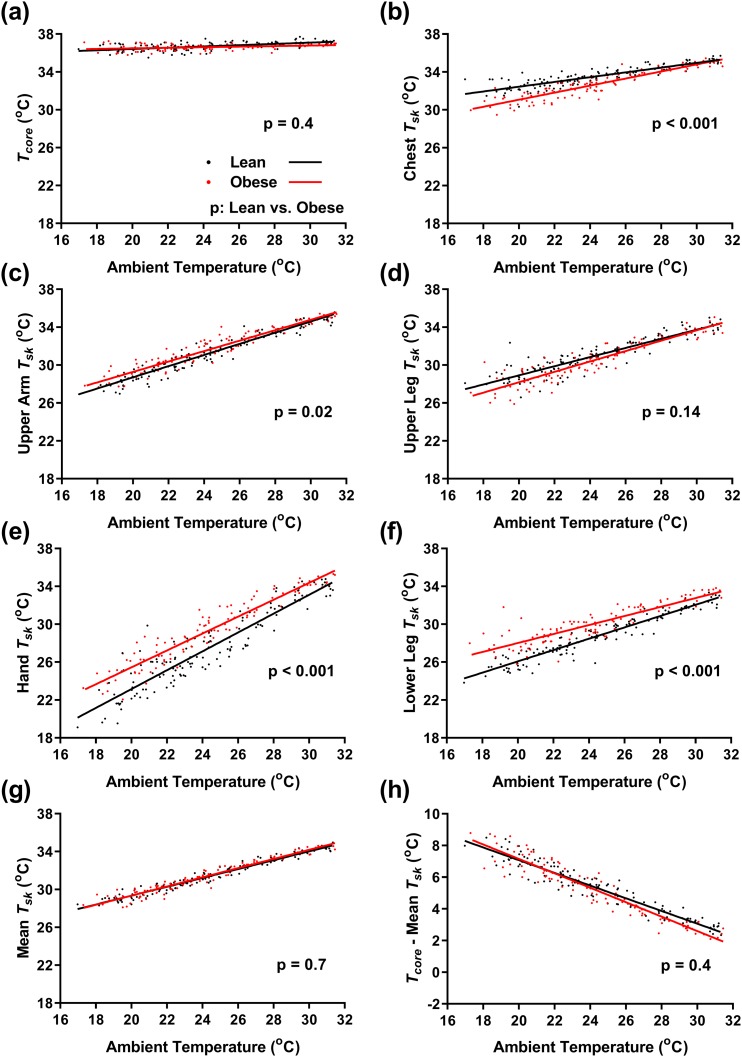
Figure 3.
Effect of Ta on core and Tskin. Linear regression of the indicated temperatures of lean men (black, n = 12) and men with obesity (red, n = 9) as a function of Ta. (a) Tcore and Tskin (Tsk) of the (b) chest, (c) upper arm, (d) upper leg, (e) hand, (f) lower leg, and (g) weighted mean. (h) Gradient from the core to skin. P values are results of mixed-effects model post hoc tests for differences between lean men and men with obesity.

