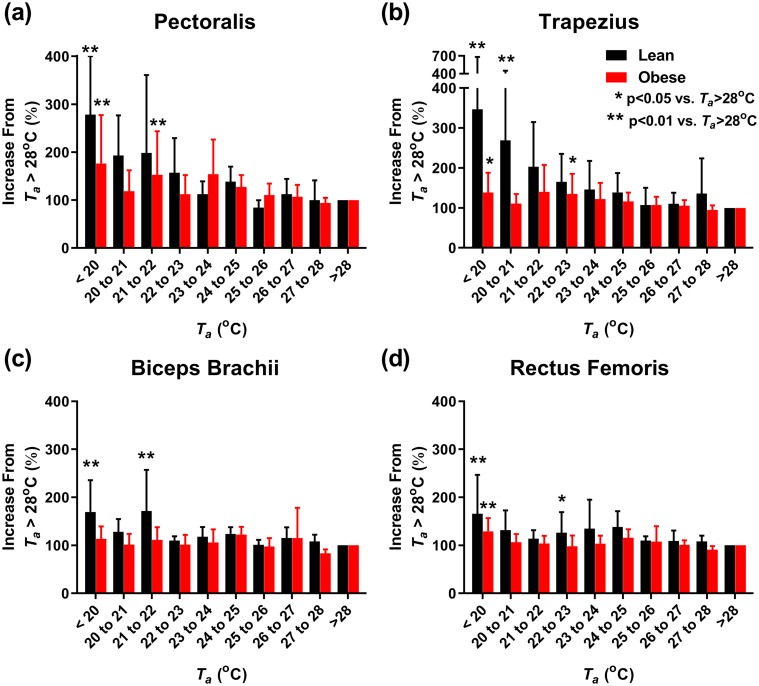
Figure 4.
Individual muscle response to Ta. (a–d) Nonvoluntary muscle activity, as quantitated by the RMS surface EMG during motionless periods at the indicated Ta and expressed as a percentage of average EMG activity at Ta > 28°C. Muscle groups are the following: (a) pectoralis major, (b) trapezius, (c) biceps brachii, and (d) rectus femoris. Lean subjects (n = 12) in black; subjects with obesity (n = 9) in red. Significant differences from Ta > 28°C are indicated for *P < 0.05 and **P < 0.01.

