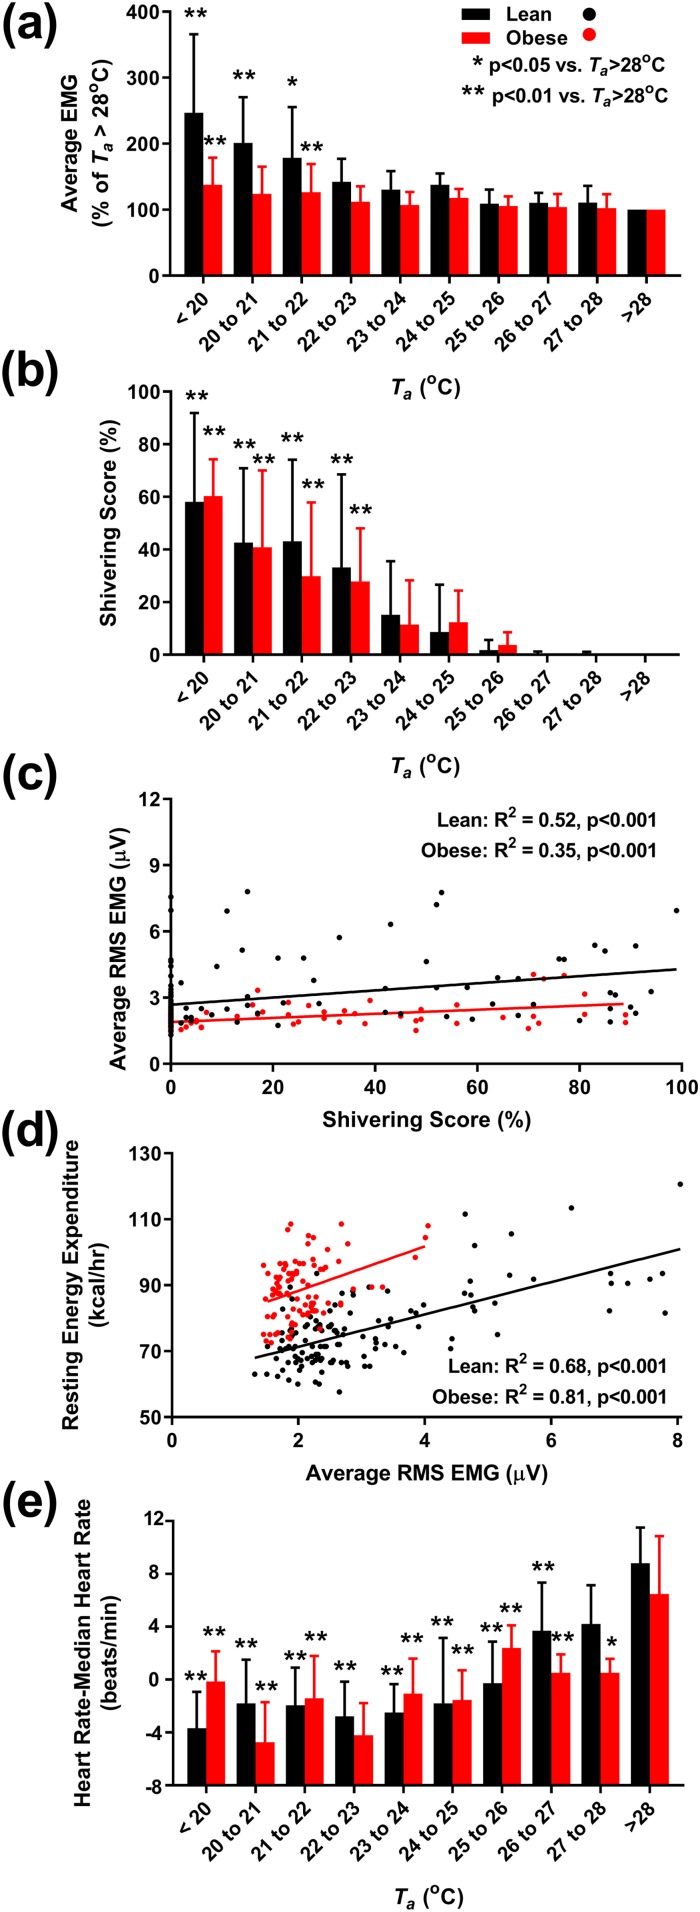
Figure 5.
Muscle and heart rate response to Ta. (a) Nonvoluntary muscle activity, as quantitated by the RMS surface EMG, averaged from four muscle groups (pectoralis major, trapezius, biceps brachii, and rectus femoris) during motionless periods at the indicated Ta and expressed as a percentage of average EMG activity at Ta > 28°C. (b) Dependence of self-reported shivering on Ta, measured after 4 hours of exposure. (c) Positive correlation between average EMG activity and shivering score. (d) Positive correlation between EMG activity and resting EE. (e) Resting heart rate (expressed as change from individual median heart rate) is higher at warmer Ta. Lean subjects (n = 12) in black; subjects with obesity (n = 9) in red. (a, b, and e) Significant differences from Ta > 28°C are indicated for *P < 0.05 and **P < 0.01. (c and d) R2 and P values are results of mixed-effects models with subject identifier as the random effect.

