Figure 6.
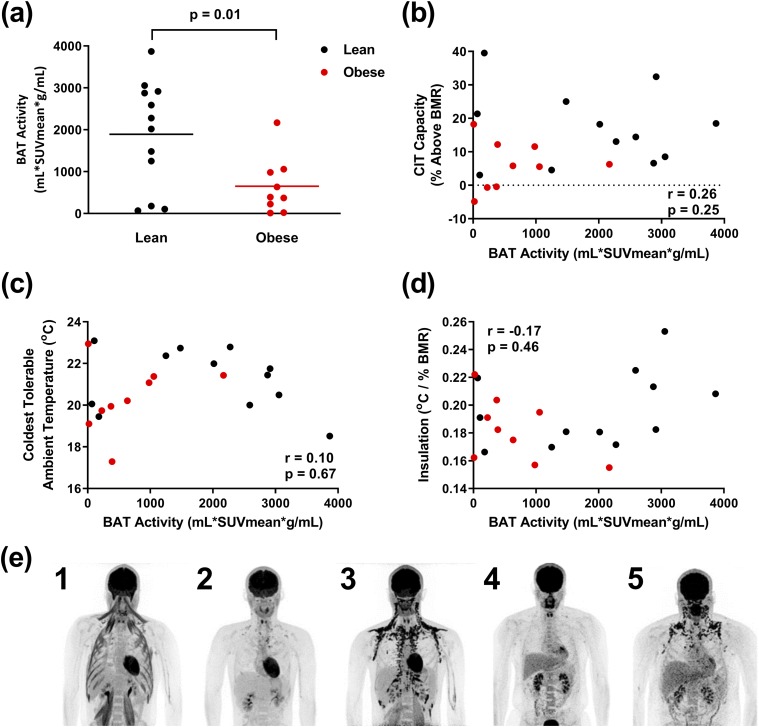
BAT activity measurement by 18F-FDG PET/CT. (a) BAT activity is greater in lean subjects (black, n = 12) than subjects with obesity (red, n = 9). (b–d) BAT activity is not correlated with (b) capacity of CIT, (c) coldest tolerable temperature, or (d) insulation. (e) Examples of PET/CT scans demonstrating variable 18F-FDG uptake by BAT and skeletal muscle in lean subjects (1–3) and subjects with obesity (4 and 5). In subject 1, note the lack of BAT 18F-FDG uptake despite 18F-FDG signal in muscle, indicative of shivering.

