Figure.
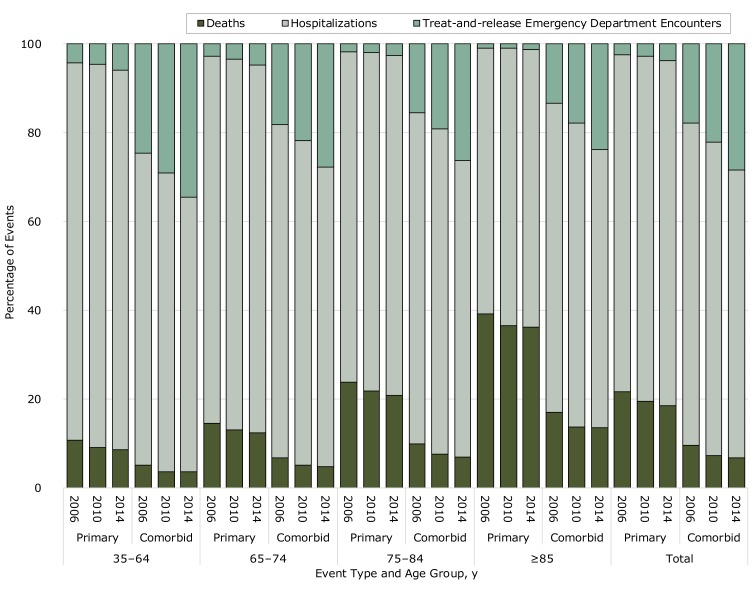
Percentage of cerebrovascular disease events that were treat-and-release ED encounters, hospitalizations, and deaths, by event type, age group, and year, Nationwide Emergency Department Sample, National Inpatient Sample, and National Vital Statistics System, 2006–2014. Event types include primary cerebrovascular events, where cerebrovascular disease was listed as the primary cause of the ED encounter or hospitalization or as the underlying cause of death, and comorbid cerebrovascular events, where cerebrovascular disease was listed either as a comorbid condition or as a contributing cause of death.
| Age, y | Category | Year | Deaths | Hospitalizations | Emergency Department Visits |
|---|---|---|---|---|---|
| 35–64 | Primary | 2006 | 11 | 85 | 4 |
| 2010 | 9 | 86 | 5 | ||
| 2014 | 9 | 86 | 6 | ||
| Comorbid | 2006 | 5 | 70 | 25 | |
| 2010 | 4 | 67 | 29 | ||
| 2014 | 4 | 62 | 35 | ||
| 65–74 | Primary | 2006 | 15 | 83 | 3 |
| 2010 | 13 | 84 | 3 | ||
| 2014 | 12 | 83 | 5 | ||
| Comorbid | 2006 | 7 | 75 | 18 | |
| 2010 | 5 | 73 | 22 | ||
| 2014 | 5 | 67 | 28 | ||
| 75–84 | Primary | 2006 | 24 | 74 | 2 |
| 2010 | 22 | 76 | 2 | ||
| 2014 | 21 | 77 | 3 | ||
| Comorbid | 2006 | 10 | 75 | 15 | |
| 2010 | 8 | 73 | 19 | ||
| 2014 | 7 | 67 | 26 | ||
| ≥85 | Primary | 2006 | 39 | 60 | 1 |
| 2010 | 37 | 63 | 1 | ||
| 2014 | 36 | 63 | 1 | ||
| Comorbid | 2006 | 17 | 70 | 13 | |
| 2010 | 14 | 68 | 18 | ||
| 2014 | 14 | 63 | 24 | ||
| Total | Primary | 2006 | 22 | 76 | 2 |
| 2010 | 19 | 78 | 3 | ||
| 2014 | 19 | 78 | 4 | ||
| Comorbid | 2006 | 10 | 73 | 18 | |
| 2010 | 7 | 71 | 22 | ||
| 2014 | 7 | 65 | 28 |

