Figure 1.
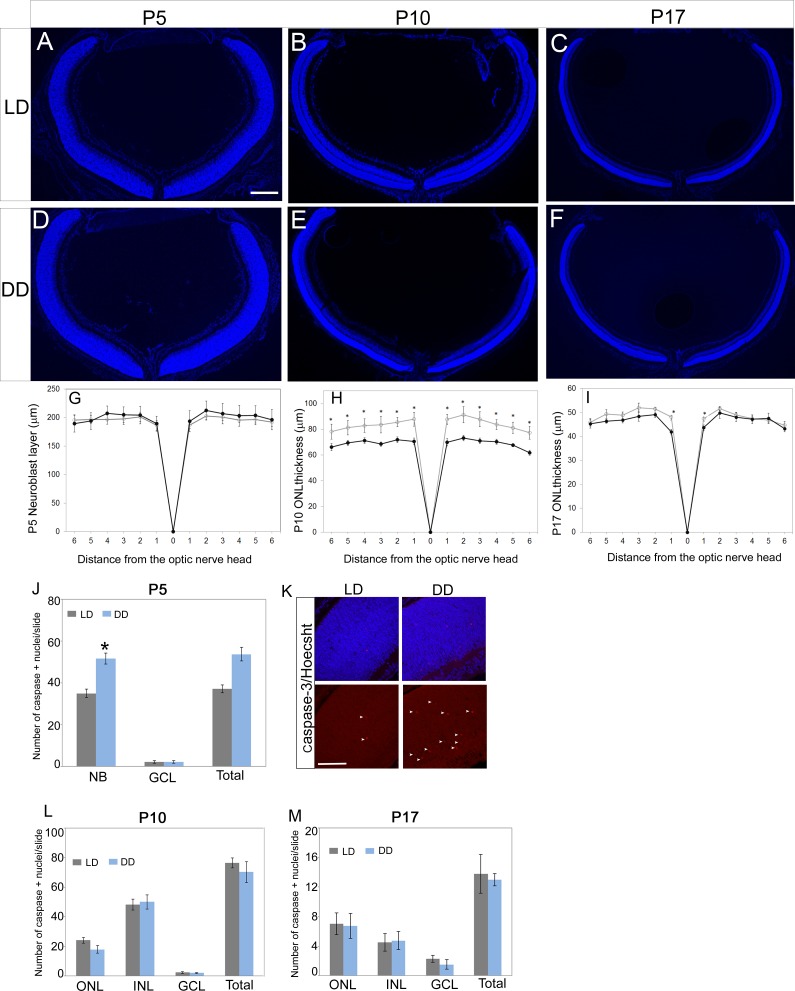
Retinal thickness measurements and apoptotic cell counts. Images (×5) of retinal sections around optic nerve region from P5 (A, D), P10 (B, E), and P17 (C, F) pups from LD and DD groups. (G–I) Spider plots represent the thickness measurements for neuroblastic layer at P5 (G) and ONL at P10 (H) and P17 (I). Outer nuclear layer thickness at P10 was significantly decreased in DD pups compared to the LD pups. Pups from the LD group were raised in normal cyclic light-dark (LD) conditions (14 hours light, 8 hours dark), and pups from the DD group were raised in constant darkness (24 hours dark) from their day of birth. Outer nuclear layer thickness was measured at constant intervals (230 or 320 μm), starting from the optic nerve head (ONH) and extending toward the periphery. (J–M) Bar graph represents the total number of active caspase-3–positive cells per retinal section across different retinal layers at P5 (J), P10 (L), and P17 (M). (K) Active caspase-3 (red)-positive nuclei in P5 LD and DD retinas are shown by arrowheads. In this study, four to six eyes from at least two different litters were used in each group, and two to five sections around the optic nerve region from each eye were imaged and used for quantitative analysis. Data points indicate average ± SEM. Student's t-test was performed between the groups at each data point, and the asterisk indicates statistical significance with P < 0.05. NB, neuroblastic layer; ONL, outer nuclear layer; GCL, ganglion cell layer. Scale bars: 300 μm (A); 25 μm (K).

