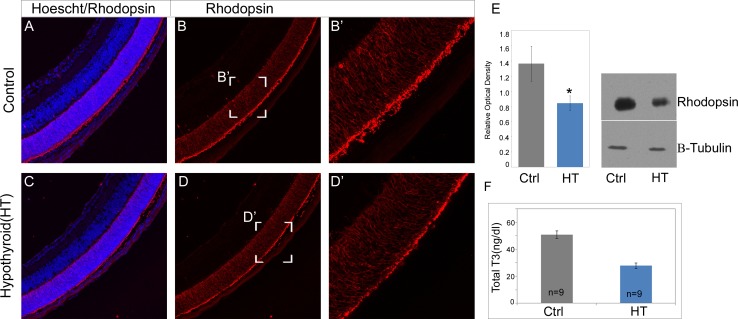
Figure 6.
Rhodopsin immunofluorescence and protein quantification in hypothyroid pups. Rhodopsin immunofluorescence (red) in placebo (control) and hypothyroid pups at P10 (A–D). Western blot image of rhodopsin and β-tubulin (housekeeping protein) and quantification of relative optical density at P10 (E). Serum T3 levels in placebo (Ctrl) and hypothyroid pups at P10 (F). Data points indicate average ± SEM. n = 6–9 in each group from two to four different litters in each group. Student's t-test was performed between the groups at each data point, and asterisk indicates statistical significance with P < 0.05.

