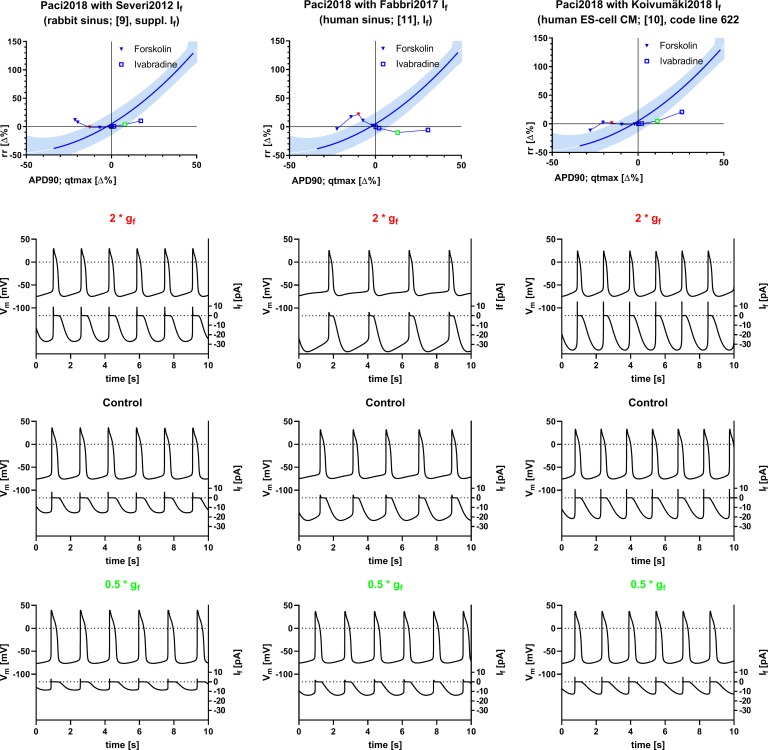
Fig 3. Inter-relation of rr and repolarization (APD90 for simulations, qtmax for experimental data) after modulation of gf in the Paci2018 [7] model with modified If.
If, in the model from [7] was substituted with the equation for If from [9] (Severi2012, left column), [11] (Fabbri2017, middle column), and [10] (Koivumäki2018, right column). For an explanation of colors, symbols, and simulated traces see Fig 1. The graphical representation of experimental data is modified from [1] and for illustrative purposes only.

