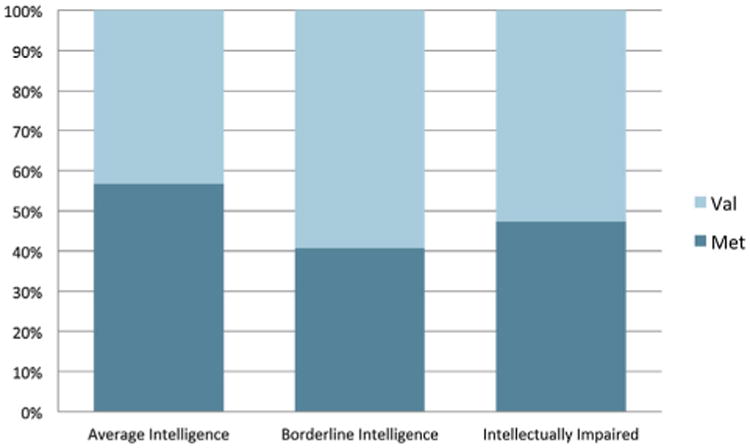
Fig. 1. Genotype frequency distribution by IQ levels. Frequency of each genotype based on IQ level. The y-axis in the figure is the percentage of individuals in a given IQ class by genotype. Average intelligence is defined as an IQ IQ ≥ 80, borderline intelligence as IQ = 70–79, and intellectually impaired as IQ < 70.