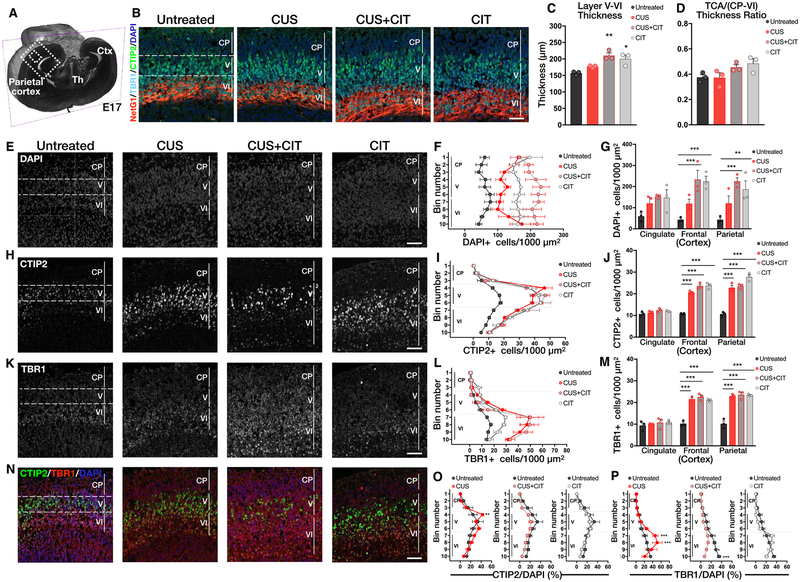
Figure 5.
Exposure to CIT mitigates maternal CUS effects on deep-layer cortical development at E17. (A) The dashed box indicates the parietal cortex region-of-interest depicted throughout the figure. Ctx, cortex; Th, thalamus. (B) Representative coronal sections of E17 brains immunostained for CTIP2 (cortical layer V), TBR1 (cortical layer VI), and netrin-G1 (NetG1;TCA). Scale bar = 50 μm. (C) Cortical layer V–VI thickness was significantly increased in the CUS+CIT and CIT groups. (D) The TCA/(CP to layer VI) thickness ratios were similar in all groups. (E) Representative images of DAPI+ cells in the CP to layers V–VI of the parietal cortex. (F, G) The numbers of DAPI+ cells were increased in the CP to layer VI in CUS +CIT and CIT groups in the frontal and parietal cortex but not the cingulate cortex compared to untreated controls; CUS had no significant effect. (H) Representative images of CTIP2+ cells in cortical layers V–VI. (I, J) The numbers of CTIP2+ cells were significantly increased in layer V in CUS, CUS +CIT, and CIT groups compared to untreated controls in the frontal and parietal but not cingulate cortex. (K) Representative images of TBR1+ cells in cortical layers VI. (L, M) The numbers of TBR1 + cells were significantly increased in cortical layer V–VI in CUS, CUS+CIT, and CIT groups compared to untreated controls in frontal and parietal cortex but not cingulate cortex. (N) Colocalization of CTIP2+, TBR1+, and DAPI+ cells in layers V–VI of the parietal cortex. (O, P) The numbers of CTIP2+ and TBR1+ cells normalized to total cell numbers (CTIP2/DAPI% and TBR1/DAPI%, respectively) in CP to layer VI were increased in CUS but not in CUS+CIT and CIT groups when compared to the untreated control group. Data are means ± SEMs; N = 3 dams per condition, 3 fetal brains per dam for quantification. *P < 0.05, **P < 0.01, or ***P < 0.001. Scale bars = 50 μm.

