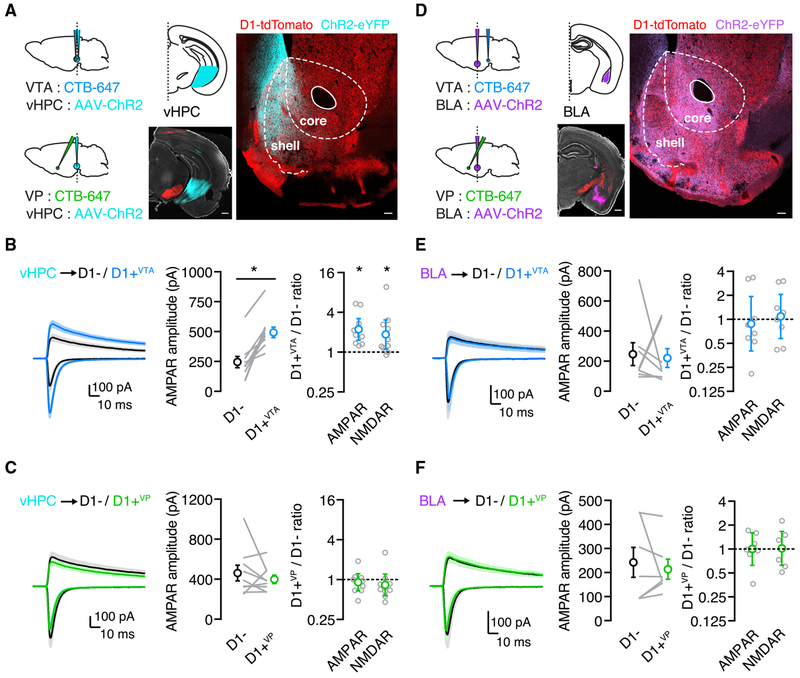
Figure 2. vHPC Inputs Are Stronger onto D1+VTA Cells in Naive Mice.
(A) Left: schematic for injections of AAV-ChR2-eYFP into the vHPC and CTB-647 into the VP or the VTA. Right: representative image of viral expression in the vHPC (scale bar, 500 μm) and of dense vHPC axon labeling in the NAcMS (scale bar, 100 μm).
(B) Left: vHPC inputs evoke larger EPSCs at D1+VTA MSNs compared with neighboring D1− MSNs. Middle: summary of the absolute amplitude of vHPC-evoked AMPAR EPSCs at D1− and D1+VTA MSNs, where lines indicate pairs of recorded neurons. Right: summary of D1+VTA/D1− amplitude ratios for AMPAR EPSCs at −70 mV and NMDAR EPSCs at +40 mV.
(C) Similar to (B), showing no bias of vHPC inputs onto pairs of D1+VP and D1− MSNs.
(D) Left: schematic for injections of AAV-ChR2-eYFP into the BLA and CTB-647 into the VP or the VTA. Right: representative image of viral expression in the BLA (scale bar, 500 μm) and of BLA axon labeling in the NAcMS (scale bar, 100 μm).
(E) Left: there is no bias of BLA-evoked EPSCs at D1+VTA MSNs compared to neighboring D1− MSNs. Middle: summary of the absolute amplitude of BLA-evoked AMPAR EPSCs at D1− and D1+VTA MSNs, where lines indicate pairs of recorded neurons. Right: summary of D1+VTA/D1− amplitude ratios for AMPAR EPSCs at −70 mV and NMDAR EPSCs at +40 mV.
(F) Similar to (E) showing no bias of BLA-evoked EPSCs at D1+VP MSNs compared to neighboring D1− MSNs.
Average traces are presented as mean ± SEM. Ratio data are presented as geometric mean with 95% CI on logarithmic axes. *p < 0.05.
See also Figure S1.

