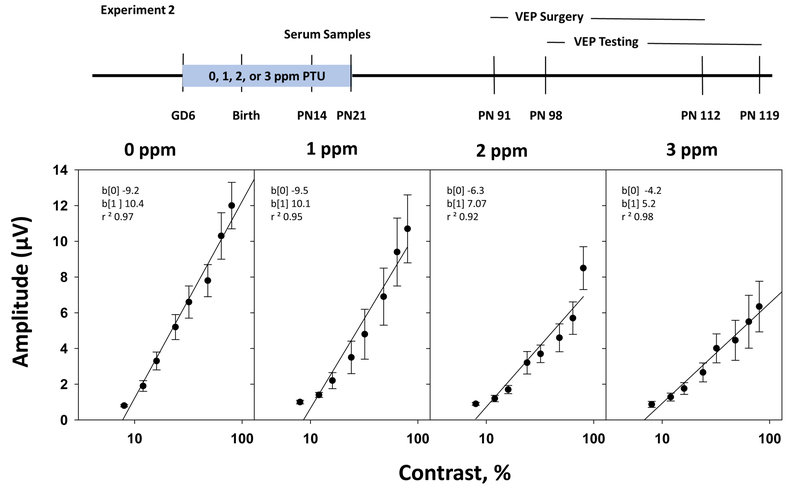
Figure 3.
(Experiment 2). VEP Contrast-Amplitude Functions: Plots of VEP F2 amplitude vs. pattern contrast (log scale) for adult offspring treated with 0, 1, 2, or 3 ppm PTU during development. The zero-amplitude intercept of the linear regression function is interpreted as the threshold for contrast perception, and the slope is interpreted as contrast gain. The horizontal dashed lines reflect the mean recording noise levels. Mean values that were < noise + 3(SE) were eliminated when fitting the regression functions. Rats treated with 2 or 3 ppm PTU showed a statistically significant dose-by-contrast interaction, which is evident as a dose-dependent reduction of the slope of the contrast-amplitude function. No significant change was observed in contrast intercept values. The changes observed in the slope of the VEP contrast-amplitude function appeared to reflect a reduction of contrast gain.

