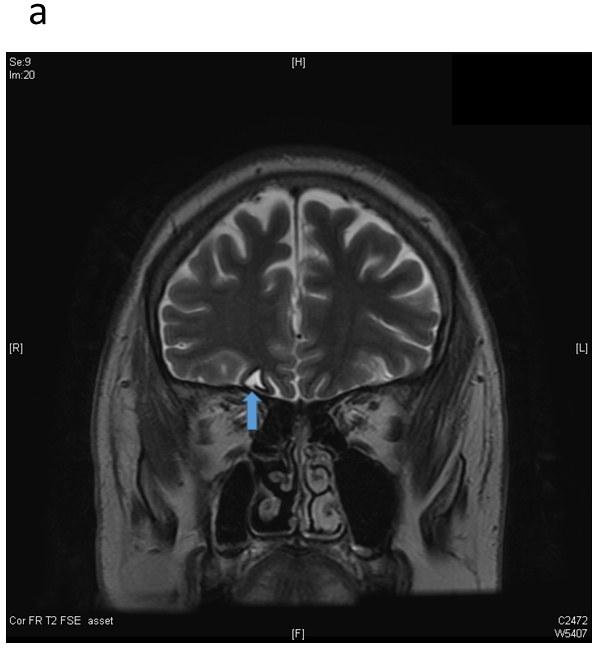
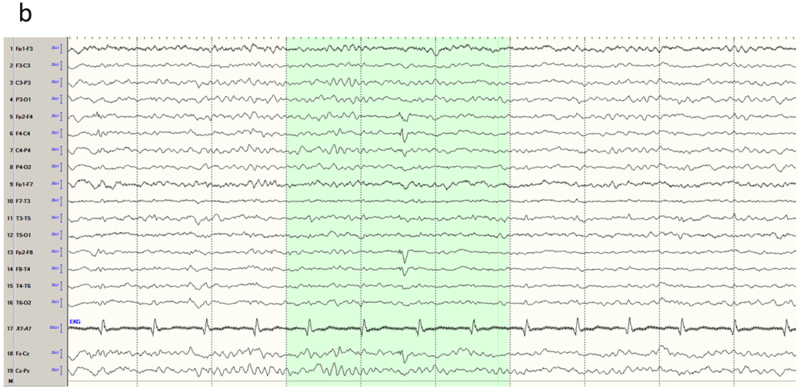
Figure 2.


Frontopolar/orbitofrontal epilepsy. a) Coronal T2 sequence through the frontal lobes showing a hemosiderin ring around a small focus of encephalomalacia (arrow) in the right basal frontal region. b) Sleep interictal EEG shows a right frontal spike, maximal (isopotential) at Fp2/F4.
