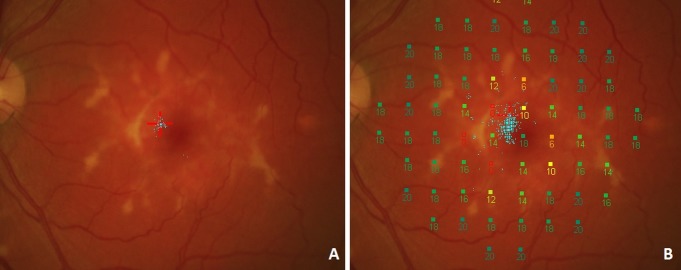
Figure 1.
Fixation was tested during a separate fixation task (A) where the patient was instructed to focus on the center of a red cross. Blue dots represent the recorded fixation events. Afterward, fixation was determined during a sensitivity exam (B). Here, a higher number of fixation points is available as a result of the longer test duration. Fixation events also seem to be more widely scattered during the sensitivity exam.

