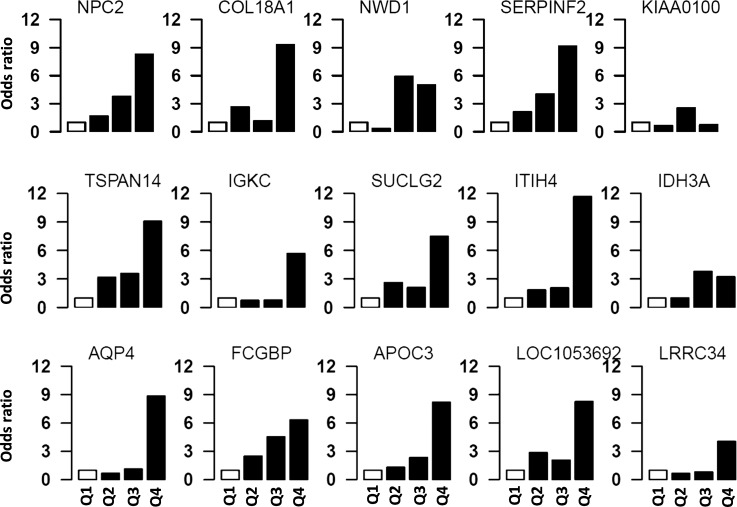
Figure 3.
The risk of POAG in subjects with different protein quartiles. Individual protein levels were used to assess the OR of having POAG at different protein levels. All subjects were divided into four quartiles (Q1–Q4) based on protein levels. The first quartile (Q1) was used as reference, and ORs of having POAG was calculated for upper three quartiles. Analyses using quartiles revealed that risk of POAG increases with increasing levels of these proteins. The open bar represents the first quartile as reference (OR = 1). From left to right, each of the other three solid bars represent second to fourth quartiles (Q2–Q4).

