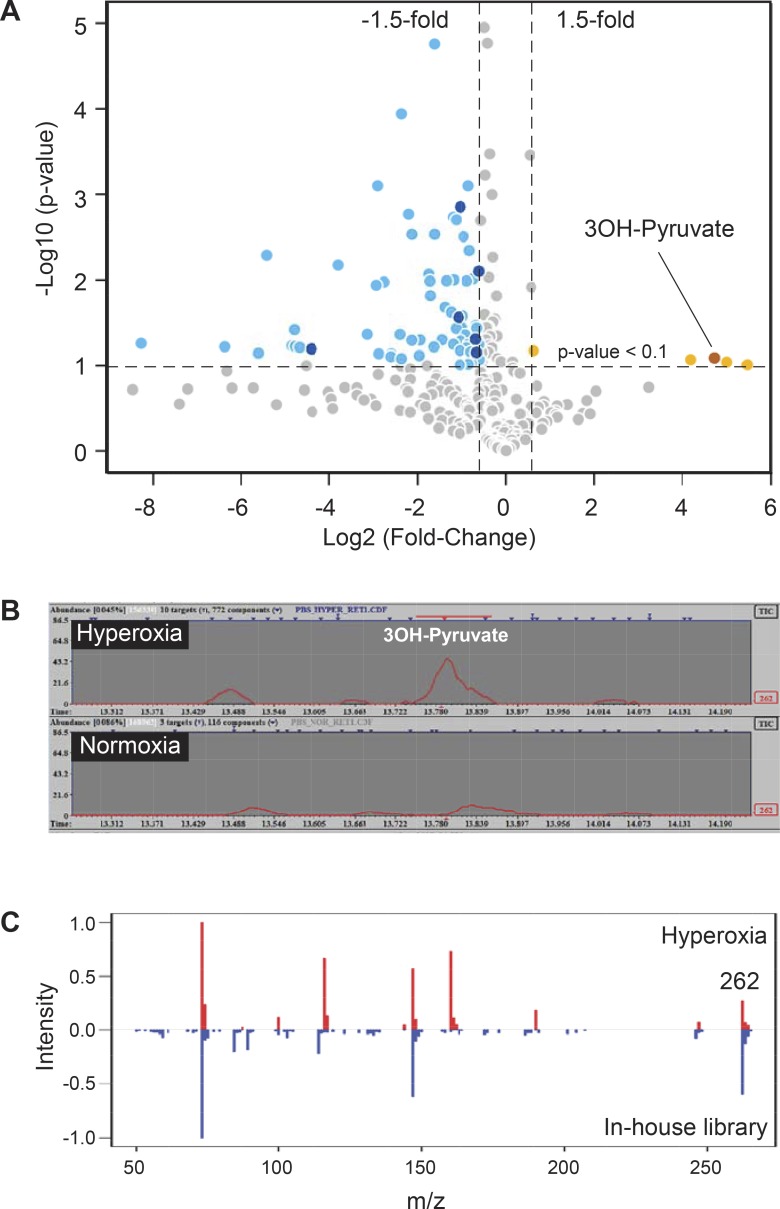
Figure 1.
Hyperoxia-induced accumulation of 3OH-pyruvate in the retina. (A) Volcano plot representing changes in retinal content of metabolites isolated from mouse pups subjected to 75% oxygen (hyperoxic, n = 6; normoxic, n = 4). Identified compounds that are decreased and increased are represented by darker blue and brown circles, respectively and listed in the Table. (B) Extracted ion chromatogram for m/z 262 depicting increased concentration of 3OH-pyruvate in hyperoxic retina. (C) Head-to-tail spectral comparison of 3OH-pyruvate in retina to an in-house metabolite library.

