Figure 3.
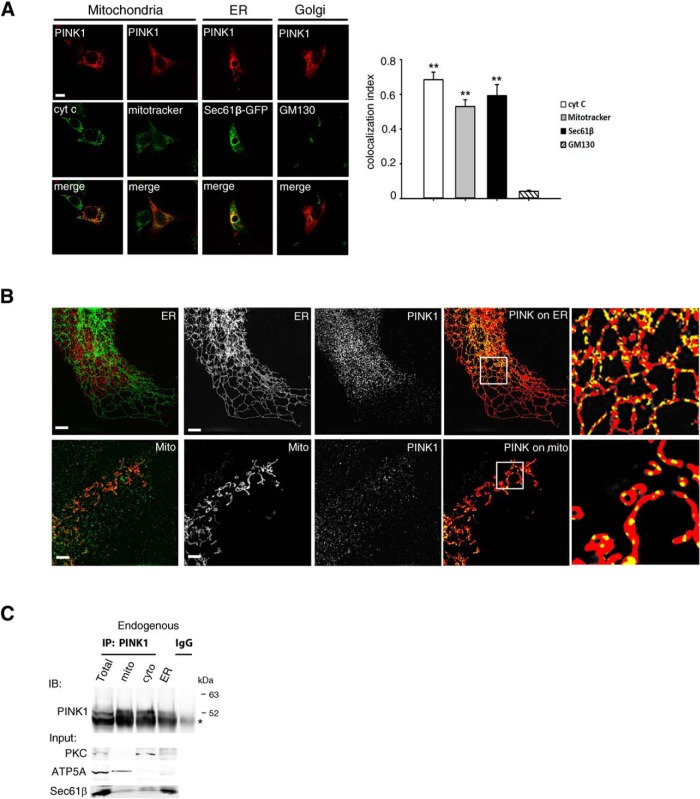
PINK1 is localized in both the mitochondria and the ER. A, Colocalization between PINK1 and organelle markers. Cells were transiently transfected with PINK1 (red) and costained with cytochrome c (cyt c) or MitoTracker (mitochondria), Sec61β-GFP (ER), and GM130 (Golgi; green). Representative images were shown (left) and the quantification (right) was done by ImageJ software. Scale bar, 10 μm. **p < 0.001 difference from GM130, but p > 0.05 cyto C versus MitoTracker versus Sec61β (one-way ANOVA, F(3,8) = 48.13, p < 0.001, followed by a Holm-Sidak's post hoc test). B, COS-7 cells (ATCC) were transfected with PINK1 expression vectors and ER marker Sec61β-GFP or mitochondrial marker Mito-DsRed. Images were acquired in 3D-SIM mode using excitation at 488 and 561 nm and standard filter sets for green and red emission. Image z-stacks were collected with a z interval of 200 nm. SIM image reconstruction, channel alignment, and 3D reconstruction were performed using NIS-Elements AR and Fiji (Schindelin et al., 2012). SIM reconstructed images were threshold, using consistent thresholds for each channel. A binarized mask was created for each channel. Representative images of ER or mitochondria (left) PINK1 (center), and a composition of the PINK1 mask (yellow) on top of the ER/mitochondria mask (red) are shown. Unmasked overlays are shown in the first panel. Scale bar, 2 μm. C, PINK1 IB of purified subcellular fractions from HeLa cells (n = 3). Endogenous PINK1 in was enriched by MG132 treatment for 6 h, and then proceeded for IP using anti-PINK1 antibody. Note that 52 kDa PINK1 migrates slightly above the heavy chain of IgG (*).

