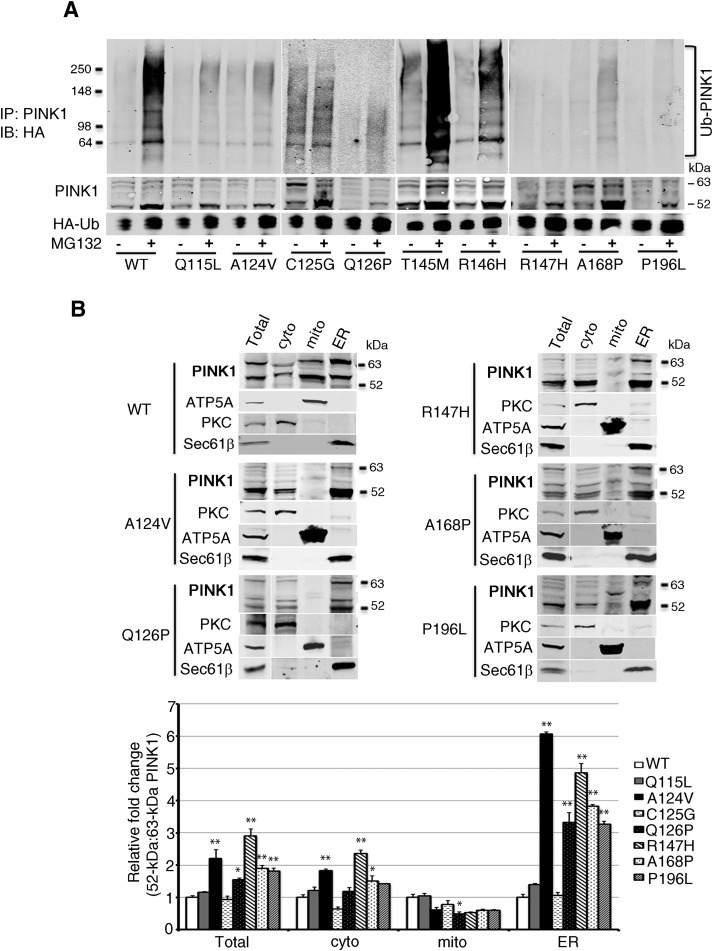
Figure 5.
Ubiquitination level and subcellular fraction in PD pathogenic PINK1 mutants. A, Ub-PINK1 IB of HEK293T cells cotransfected with HA-Ub and PINK1 pathogenic mutants exposed to MG132 for 6 h. This experiment was repeated once independently with similar results. B, Top, PINK1 IB of purified subcellular fractions of cells that express PINK1 WT and pathogenic mutants. Bottom, PINK1 52 kDa:63 kDa ratio relative to WT PINK1 expressing cells in each subcellular fraction. *p < 0.01, **p < 0.001 difference from WT controls (two-way ANOVA, interaction mutation × subcellular fraction: F(21,64) = 42.85, p < 0.001, followed by a Holm-Sidak's post hoc test).

