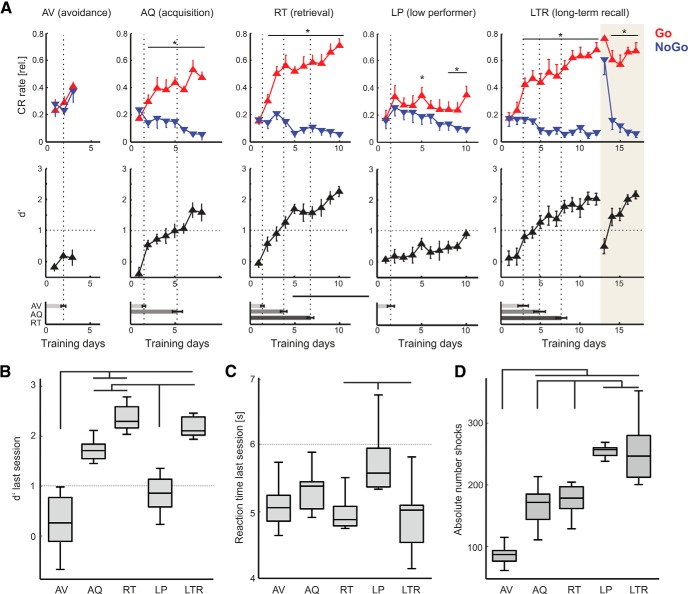
Figure 2.
Learning curves (LCs) of animals trained to reach distinct learning stages for subsequent Western blot analysis. A, Top, CR curves (mean ± SEM) of adult male C57BL/6N mice (n = 39; n = 8 in each group; LP = 7) in a Go/NoGo shuttle-box-paradigm during FM discrimination (4–8 vs 8–4 kHz). Relative hit rate (red) is plotted against relative false alarm rate (blue) across training days (1 session per day/60 trials). Middle, Sensitivity index d′ (mean ± SEM) was used to define distinct learning stages from avoidance, acquisition, retrieval, and a group of LP animals. Another set that reached the retrieval-stage was trained for another 5 d after a retention interval of 4 weeks to test their LTR performance. Bottom, Averaged number of sessions of each group to reach the respective learning stages (mean ± SEM) did not show significant differences across groups (Table 1A). Corresponding dotted lines in top indicate learning stage transitions. *Paired Student's t test, p < 0.05. Abbreviations for training stages will be used in following figures. B, Group comparison of mean d′ of last sessions across trained animal groups revealed significantly different performance levels between the AV and LP groups compared against AQ, RT, and LTR (Kruskal–Wallis; p < 0.001). C, Mean reaction times across all groups revealed significantly longest reaction times in low performing animals (Kruskal–Wallis; p = 0.012). D, Absolute number of shocks received over the training paradigm significantly increased with number of trained sessions and low performance (Kruskal–Wallis; p < 0.001). All indicated bars are based on Bonferroni-corrected significance levels. Box plots represent median (bar) and interquartile range, and whiskers represent full range of data.

