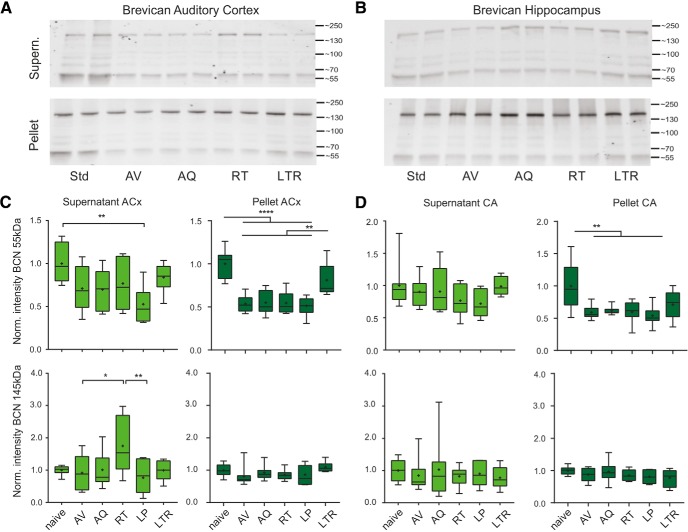
Figure 3.
Semiquantitative Western blot analysis of learning-induced changes of BCN levels in auditory cortex and hippocampus. A, B, Top, Representative Western blot example treated with mouse anti-BCN antibody directed against the N-terminus detected the full-length BCN of 145 kDa and the 55 kDa N-terminal fragment within the cellular and the ECM fraction in auditory cortex (A) and hippocampus (B). The two lanes for each group correspond to the same sample, as probes were loaded twice. Quantification of signal intensity of BCN (55 kDa, 145 kDa) in the extracellular fraction (top) and cellular fraction (bottom). C, Across training groups, full-length BCN showed an extracellular increase exclusively in the RT group (bottom left). The 55 kDa proteolytic fragment otherwise showed a general decrease, with significant difference in low-performers. In the cellular fraction, full-length proteins showed no significant changes across all training groups, whereas the 55 kDa BCN showed consistently significantly lower levels in all training groups except of the LTR group. D, In hippocampus, significant reduction was only found in the pellet fraction of the 55 kDa BCN fragment in all training groups. Other protein levels in hippocampus did not show significant changes. *Indicates significant one-way ANOVA and post hoc Tukey tests of multiple comparisons between groups (Table 1B–D). Box plots represent median (bar) and interquartile range, and bars represent full range of data. Plus within each bar represents mean value.

