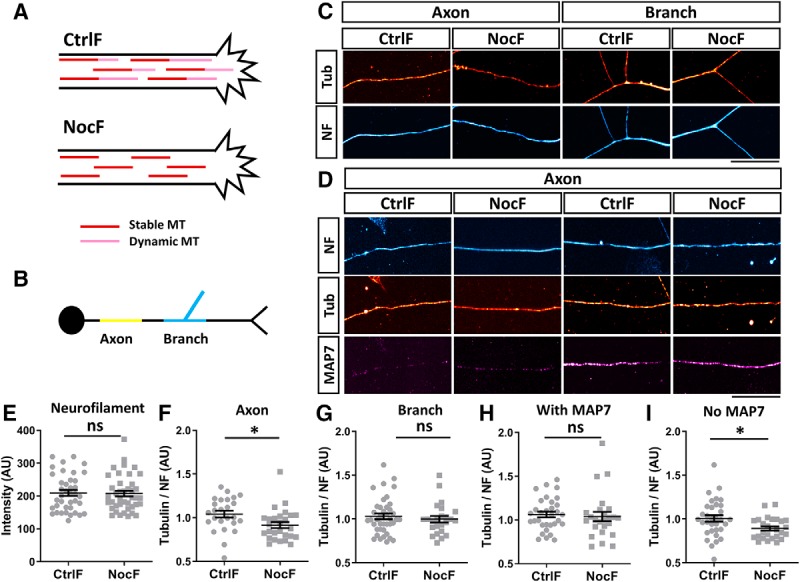
Figure 3.

MAP7 maintains stable microtubules at branch regions. A, Schematic of the use of the CtrlF or NocF method in neurons. Treatment of neurons with nocodazole before fixation removes dynamic microtubules (pink) leaving behind only stable microtubules (red). B, Schematic of different regions of the neuron analyzed. The axonal region is shown in yellow and the branch region in blue. C, Fluorescence intensity images of axon or branch regions labeled for tubulin (tub, red hot) and NF (cyan hot) after CtrlF or NocF. D, Fluorescence intensity of axonal regions with (right) or without (left) MAP7 (magenta hot) that are labeled for tubulin (tub, red hot) and NF (cyan hot) after CtrlF or NocF. E, Comparison of the neurofilament labeling after CtrlF or NocF (p = 0.8670, n = 39 for CtrlF and n = 41 for NocF, unpaired t test). F, G, Quantification of the fluorescence signal ratio of tubulin over NF in axon regions (F; p = 0.019, n = 25 for CtrlF and n = 27 for NocF, unpaired t test) or branch regions (G; p = 0.529, n = 40 for CtrlF and n = 24 for NocF, unpaired t test). H, I, Quantification of the fluorescence signal ratio of tubulin/NF in axonal regions with (H; p = 0.4015, n = 32 for CtrlF and n = 25 for NocF, Mann–Whitney test) or without MAP7 (I; p = 0.0175, n = 33 for CtrlF and n = 26 for NocF, unpaired t test). Data are reported as mean ± SEM. *p < 0.05; ns, not significant. Scale bars, 20 μm.
