Figure 7.
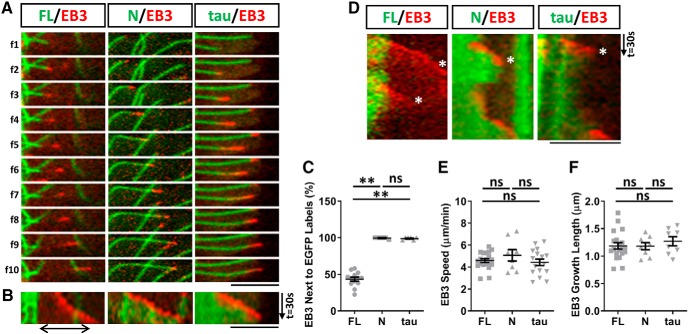
MAP7 creates a stable microtubule region that prevents depolymerization and rescues polymerization. A, Sequential fluorescence images (f1–f10) of live COS cells expressing EB3-mCherry (red) with EGFP fusions (green) of MAP7-FL (FL), MAP7-N (N), or tau. Images were compressed at the Y-axis by 1.4X, and the time interval between images is 7.4s (FL) or 3.7s (N and tau). B, Kymographs of EGFP and mCherry signals from A. A gap between FL-EGFP and EB3 is indicated by a line with double arrows. C, Quantification of the number of times EB3-mCherry comets are associated with MAP7-FL-EGFP, MAP7-N-EGFP, or tau-EGFP decorated microtubules (FL-N; p = 0.0011; FL-tau; p = 0.0016, N-tau; p = 0.9899, n = 13 for FL, n = 5 for N and n = 6 for tau, Kruskal–Wallis test). D, Kymographs of EB3-mCherry (red) with EGFP fusions (green) of FL, N and tau showing growth and shrinkage of microtubules. Catastrophe events are marked by asterisks. E, F, Comparisons of EB3 speed (E; FL-N: p = 0.5475; FL-tau: p = 0.8967; N-tau: p = 0.3692, n = 20 for FL, n = 8 for N, n = 16 for tau, One-way ANOVA) and growth length (F; FL-N: p = 0.9983; FL-tau: p = 0.6752; N-tau: p = 0.7314, n = 20 for FL, n = 8 for N, n = 8 for tau, one-way ANOVA) of polymerizing microtubules in transfected cells. Data are reported as mean ± SEM. **p < 0.01; ns, not significant. Scale bars, 5 μm.

