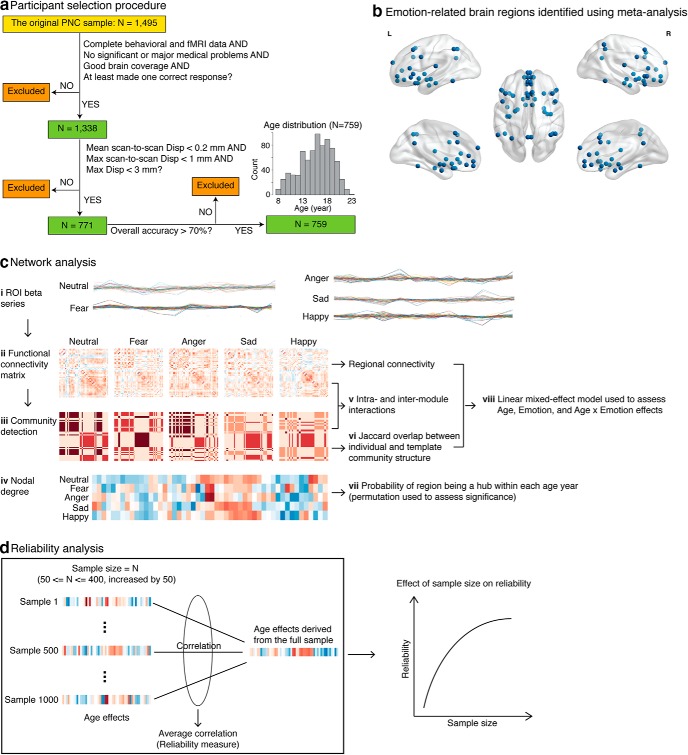
Figure 1.
Schematic view of participant selection procedure and main analysis steps. a, From the original 1495 participants, 157 were excluded due to incomplete data, medical problems, poor brain coverage, or not being able to perform the task. A total of 567 participants were excluded due to excess head motion, and 12 participants were excluded due to low task accuracy. A total of 759 participants 8–23 years of age survived these exclusion criteria. b, Brain ROIs involved in emotion perception were identified using meta-analysis implemented in Neurosynth (Yarkoni et al., 2011). They included the following: vmPFC, dmPFC, vlPFC, dlPFC, lOFC, IPL, SPL, sgACC, pgACC, dACC, PCC, pre-SMA, BLA, vAI, dAI, PI, hippocampus (Hipp), and FFG. Subcortical ROIs, including CMA, BNST, and NAc, were identified using anatomical atlases (see also Table 3). ROIs were overlaid on a reference brain surface using BrainNet Viewer (Xia et al., 2013). c, Network analysis steps used to investigate development of the affective circuits. ci, ROI β series were derived from each task condition (fear, anger, sad, happy, or neutral) for each individual. cii, Functional connectivity matrices were computed for each individual. ciii, Functional connectivity matrices were fed into a community detection algorithm to determine community structure of the ROIs. civ, ROI nodal degree was computed over a wide range of sparsity (10% ≤ sparsity ≤ 40% with an interval of 5%), and then an integrated metric of nodal degree was obtained by computing the area under the curve. cv, Intramodule and intermodule interactions were computed. cvi, Deviation of individual community structure from template community structure was measured as the Jaccard overlap between the two. cvii, ROIs were further categorized into hubs or nonhubs, and then the probability of an ROI to be a hub within each age year was calculated. Permutation test was used to assess hub significance. cviii, These resulting brain metrics were further fed into linear mixed-effect models to assess age, emotion, and age × emotion effects. d, Reliability analyses assessed the robustness of age-related findings and the effect of sample size. Briefly, we randomly drew N (sample size) participants from the full sample and assessed age-related changes in the subsample. This was repeated 1000 times across a wide range of sample sizes (50 ≤ N ≤ 400, increased by 50). Correlation between age effects from a subsample and that from the full sample was calculated and then averaged across subsamples for each sample size. The resulting average correlation was used to measure reliability.

