Figure 2.
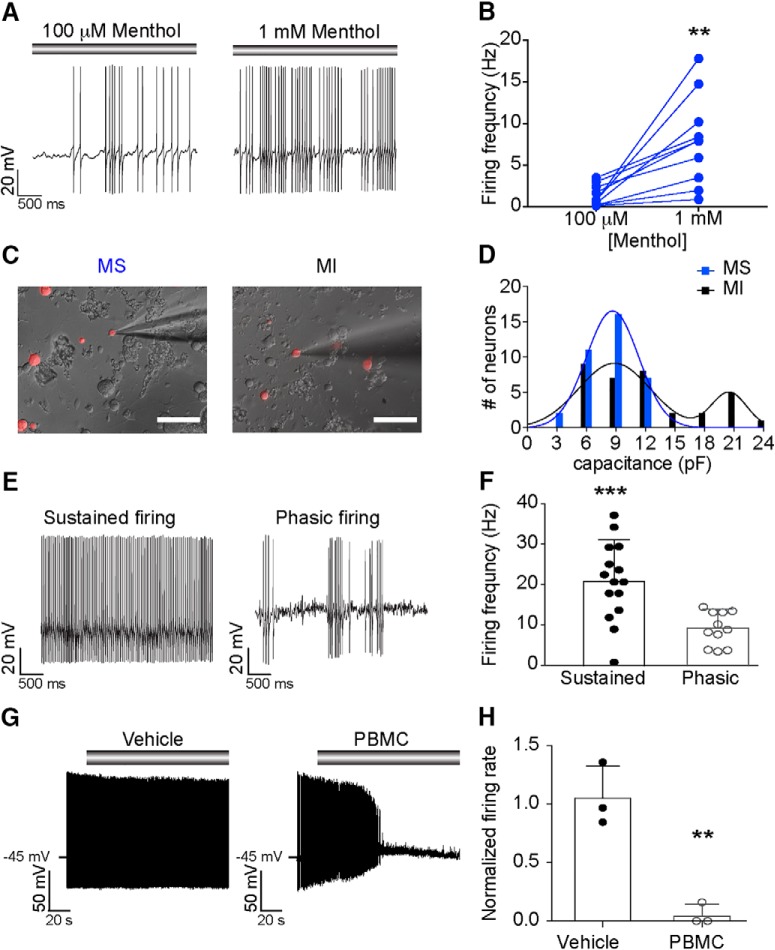
Menthol-sensitive Vglut3lineage neurons fire action potential discharges at room temperature. A, Representative current-clamp recording from a menthol-sensitive Vglut3lineage DRG neuron. Gray bar indicates menthol application (100 μm, left; 1 mm, right). B, Quantification of firing rates in response to 100 μm and 1 mm menthol. Lines connecting symbols indicate paired observations. Significance was determined using a paired Student's t test (two-tailed). **p = 0.0036. C, Representative differential interference contrast image (20×, 0.75 NA air objective) of a menthol-sensitive (MS; left) and a menthol-insensitive (MI; right) DRG neuron in culture during electrophysiological recordings. TdTomato fluorescence indicates Vglut3cre expression at some point during development (Vglut3lineage). D, Histogram of membrane capacitance measurements from MS (blue) and MI (black) Vglut3lineage neurons. Lines indicate the mean(s) of the Gaussian core. E, Left, Representative current-clamp recording from a MS neuron exhibiting sustained firing at room temperature. Right, A different MS neuron firing with a phasic action potential discharge pattern. F, Quantification of average non-evoked firing frequency of MS Vglut3lineage neurons at room temperature. Each individual point represents the average firing frequency of a single neuron over a 5 s period. Firing frequencies for phasic-firing neurons were quantified during bursts of action potentials only. Significance was determined using an unpaired Student's t test (two-tailed). ***p = 0.0009. G, Left, Representative current-clamp trace of room temperature action potential firing in a MS neuron. Vehicle treatment did not impact firing rate. Gray bar indicates vehicle application. Right, Representative current-clamp trace of inhibition of action potential firing in a MS neuron following application of the TRPM8 blocker, PBMC (25 nm). Gray bar indicates PBMC application. H, Quantification of relative firing rate following 90 s of vehicle or PBMC treatment. Significance was determined using an unpaired Student's t test. **p < 0.01. Data represented as mean ± SD. Scale bars, 100 μm.

