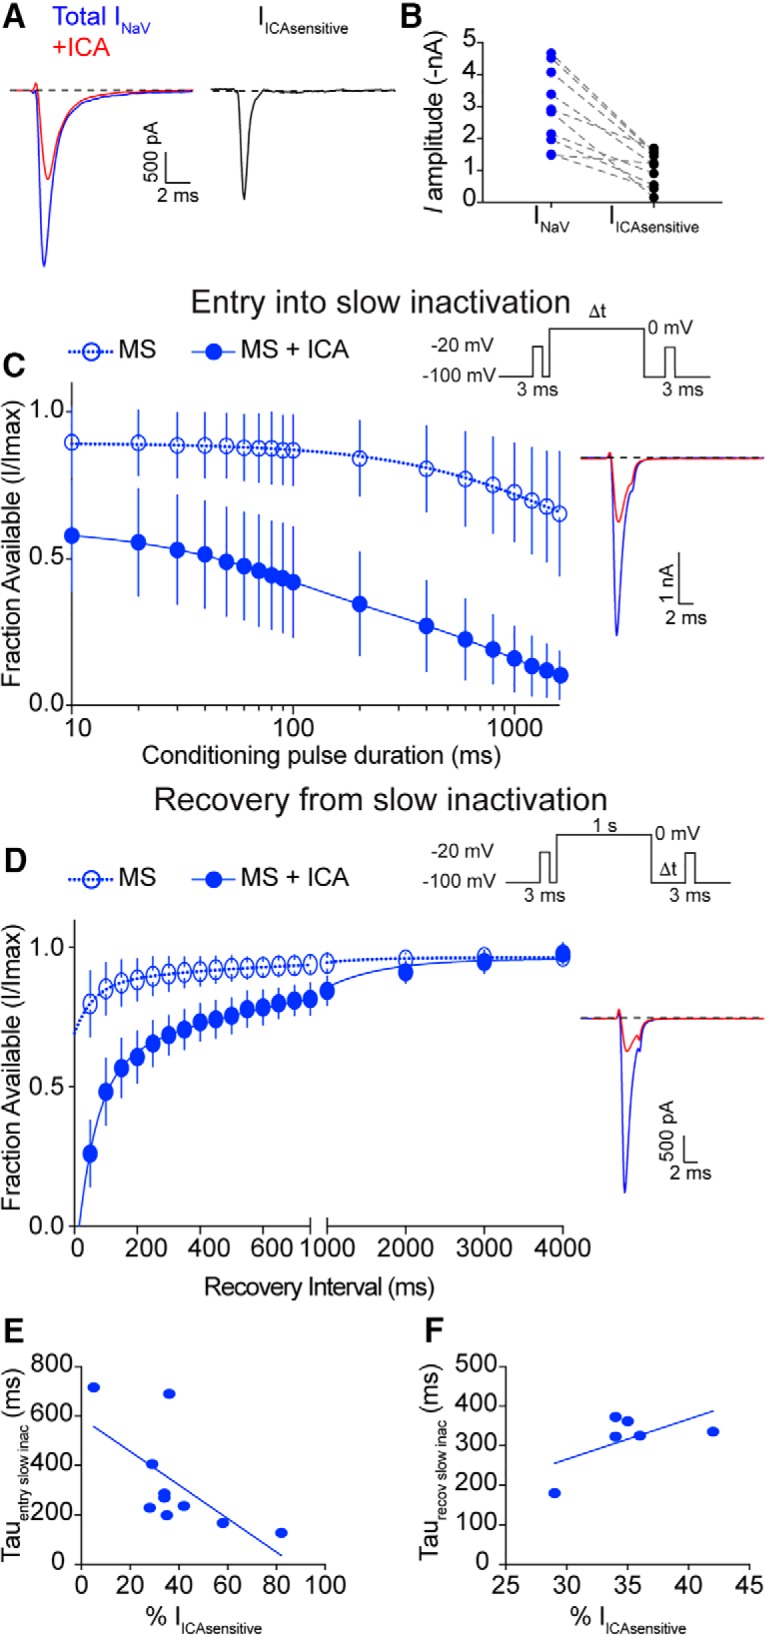
Figure 9.

NaV1.1 channels determine entry into slow inactivation rates in menthol-sensitive Vglut3lineage neurons. A, Representative whole-cell voltage-clamp traces of currents elicited from a MS neuron in the before (blue trace) and after application of 500 nm ICA 121431 (red trace). The subtracted NaV1.1-mediated current is shown in black. B, Quantification of peak NaV current amplitude before (blue circles) and after ICA 121431 application (black circles). Gray dashed lines indicated paired observations. C, Quantification of entry into slow inactivation for MS Vglut3lineage DRG neurons during blockade of NaV1.1 channels by ICA 121431 (filled circles, blue lines). Data for MS neurons from Figure 4A is shown for comparison (clear circles, dashed lines). The current elicited following a conditioning pulse to 0 mV is normalized to the current elicited during an initial test step and plotted against the duration of the conditioning pulse. Lines show exponential fits to the data. Top right, Voltage protocol used to measure NaV entry into slow inactivation. Bottom right, Representative whole-cell voltage-clamp traces. Blue trace represents initial test step; red trace represents test pulses given after a 200 ms conditioning step. D, Left, Same as C except Quantification represents recovery from slow inactivation kinetics. Data for MS neurons from Figure 4B is shown for comparison (clear circles, dashed lines). Recovery during the second test step is normalized to the current during the initial test step and plotted against the recovery interval. Lines show double-exponential fits to the data. MS neurons + ICA: τ1 = 725.1 ms, τ2 = 59.8 ms, n = 6. Top right, Voltage protocol used to measure NaV recovery from slow inactivation. Bottom right, Representative whole-cell voltage-clamp trace of current elicited from a MS neuron in the presence of ICA 121431. Blue trace represents initial test step; red trace represents pulse given 50 ms after the conditioning step. E, Individual entry into slow inactivation rates for MS neurons plotted against the percentage of the total NaV current that was sensitive to ICA 121431; r2 = 0.43, p = 0.04. F, Same as E but individual recovery from slow inactivation rates are plotted; r2 = 0.37, p = 0.20.
