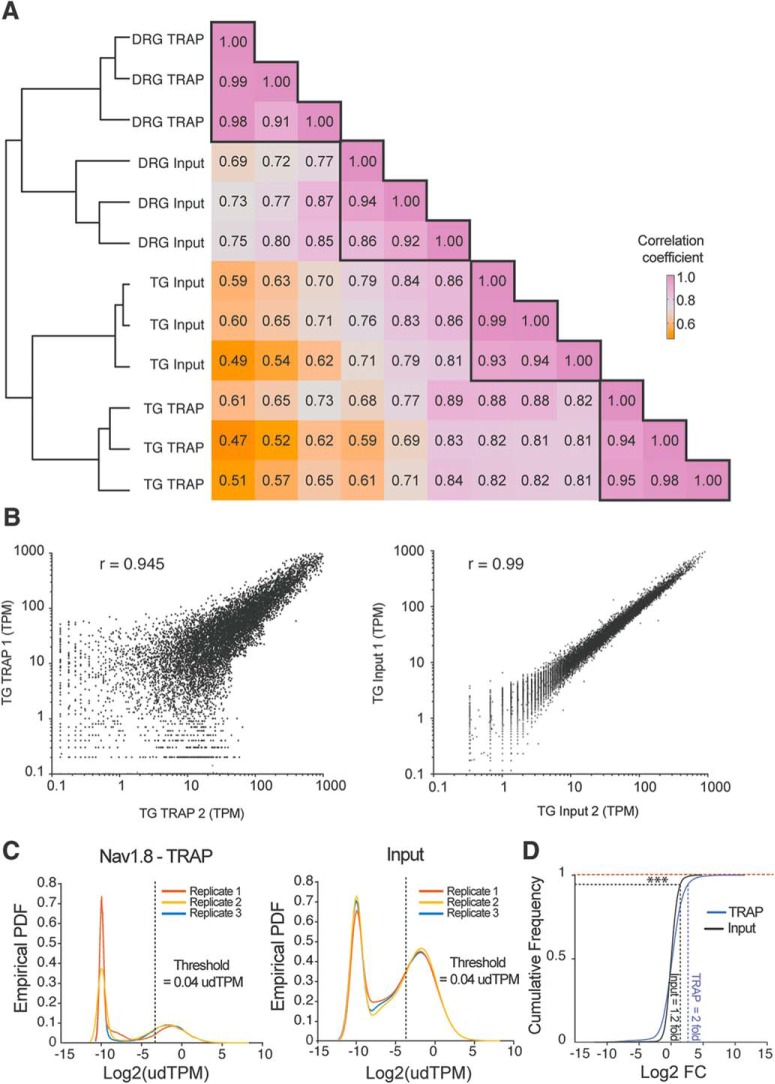
Figure 2.
DRG and TG TRAP-seq shows high correlation between biological replicates and similar sequencing depth. A, Heatmap of the correlation coefficient and cluster analysis showing clear separation between DRG and TG as well as in between TRAP-seq and bulk RNA-seq from each tissue. B, Scatter plot of input and TRAP-seq shows high correlation between biological replicates for each approach. C, Empirical probability density function (PDF) of the TPM for all genes in analysis shows a similar distribution between replicates, which are each shown as a different color, for TRAP-seq and input. D, Cumulative distribution of the fold change (FC) in input and TRAP-seq shows higher FCs in TRAP-seq samples. Kolgomorov-Smirnov test, ***p < 0.001.

