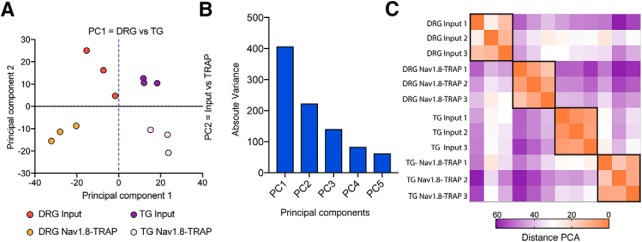
Figure 3.
PC analysis shows a clear difference between transcriptomes and translatomes in TG and DRG. A, PC analysis shows that differences between TG and DRGs whole tissue transcriptomes represent the first PC, whereas differences between transcriptome and translatome are the second PC. B, Absolute variances for each PC show that PC1 and PC2 provide the majority of variation in the entire datasets. C, Heatmap of the absolute PC distances showing 4 distinct clusters, each of which is defined by whole transcriptome (input) versus TRAP-seq and the tissue.

