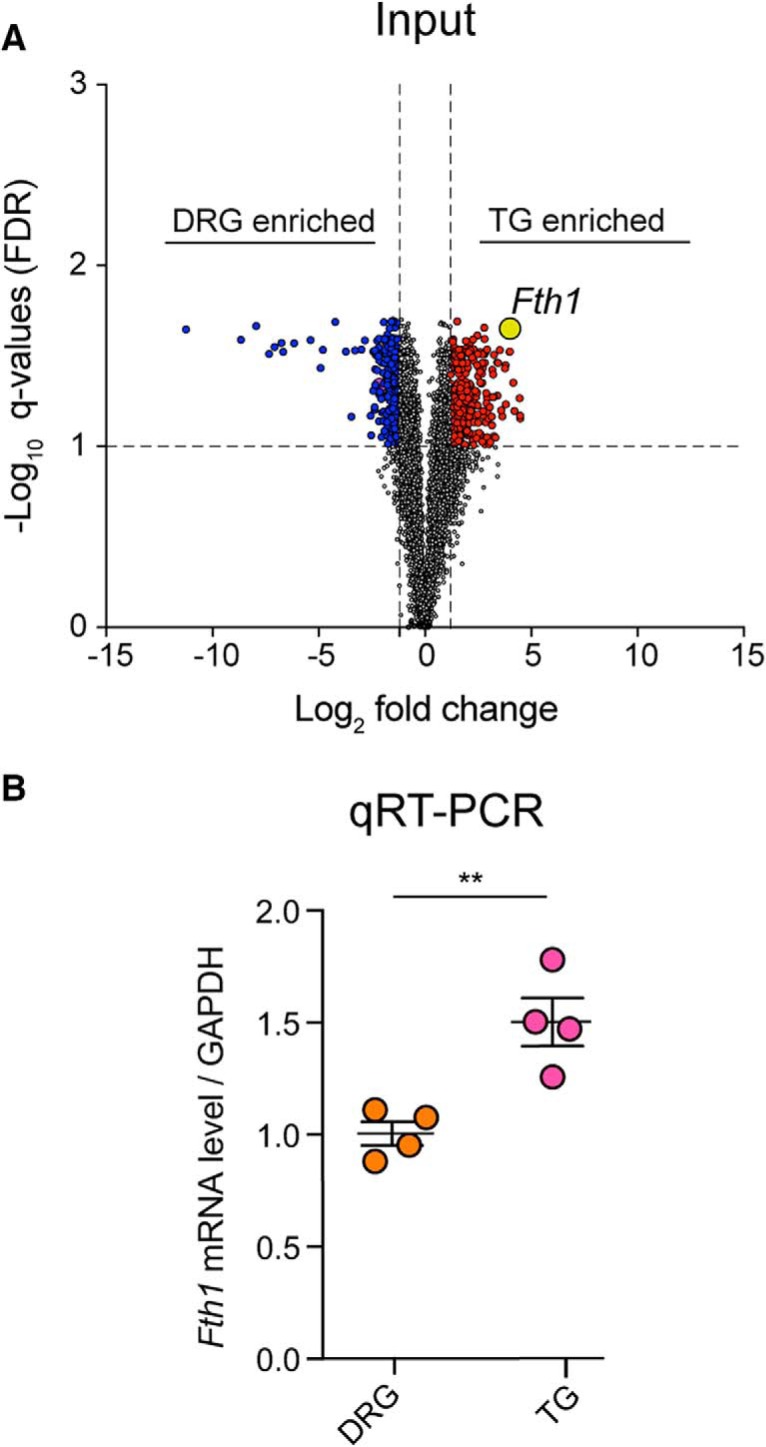
Figure 5.

RNA-seq analysis reveals Fth1 as differentially expressed in the TG and validated through qRT-PCR. A, Volcano plot shows Fth1 (yellow dot) as being significantly enriched in TG versus DRGs. B, qRT-PCR shows a 50% increase in Fth1 mRNA expression in TG. (paired t test, t = 4,15; df = 6; **p = 0.0048).
