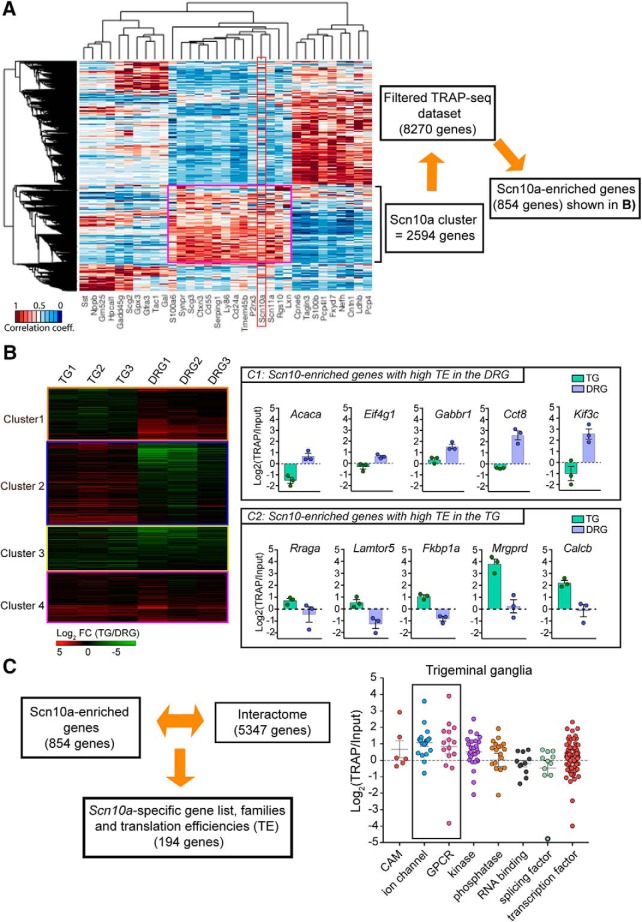
Figure 7.
TE analysis for Scn10a-enriched genes in TG- and DRG-TRAP-seq shows differential TEs between tissues. A, Heatmap showing the correlation coefficient of the protein coding genes with the most discriminative expression between cell populations based on the DRG single-cell dataset published previously (Usoskin et al., 2015; Hu et al., 2016) with Nav1.8 (Scn10a) highlighted. A cluster of 2547 genes was identified as highly enriched in the Scn10a-positive neuronal population. Those 2547 genes were then merged to the TRAP-seq filtered dataset (∼8000 genes) to identify a group of 854 mRNAs that were highly enriched in the single-cell population that also expressed Scn10a and not found in other cell populations. B, Heatmap of the TE for the 854 mRNAs shows 4 separate clusters. C1 identifies mRNAs with high TEs in the DRG but lower in TG. C2 shows genes with high TE in the TG and low TEs in the DRG. C3 identifies mRNAs with low TEs in both tissues. C4 identifies mRNAs with high TEs in both tissues. C, Calculation of TE efficiencies for gene families in the TG shows higher TEs for mRNAs coding for ion channels and GPCRs compared with splicing and transcription factors. Figure 7-1 shows estimated TEs for all genes shown in clusters in Figure 7A. Figure 7-2 shows estimated TEs by gene family.

