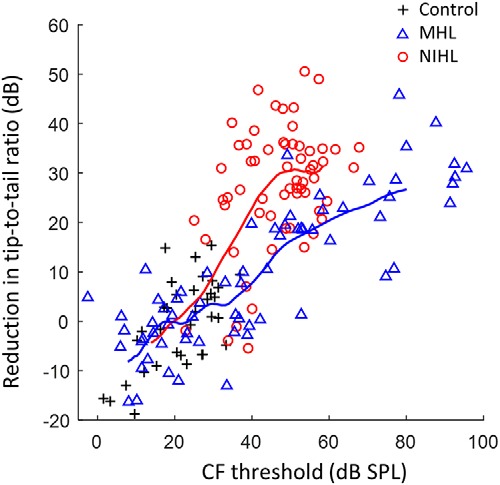
Figure 5.

Reduction in tuning curve TTR is greater with NIHL than with MHL for the same impaired CF threshold. TTR was quantified 1.5 octaves below CF and normalized for the CF dependence in normal-hearing animals (Temchin et al., 2008). Trend lines show the moving average (16 points) for MHL and NIHL. CFs range from 1.24 to 10.5 kHz.
