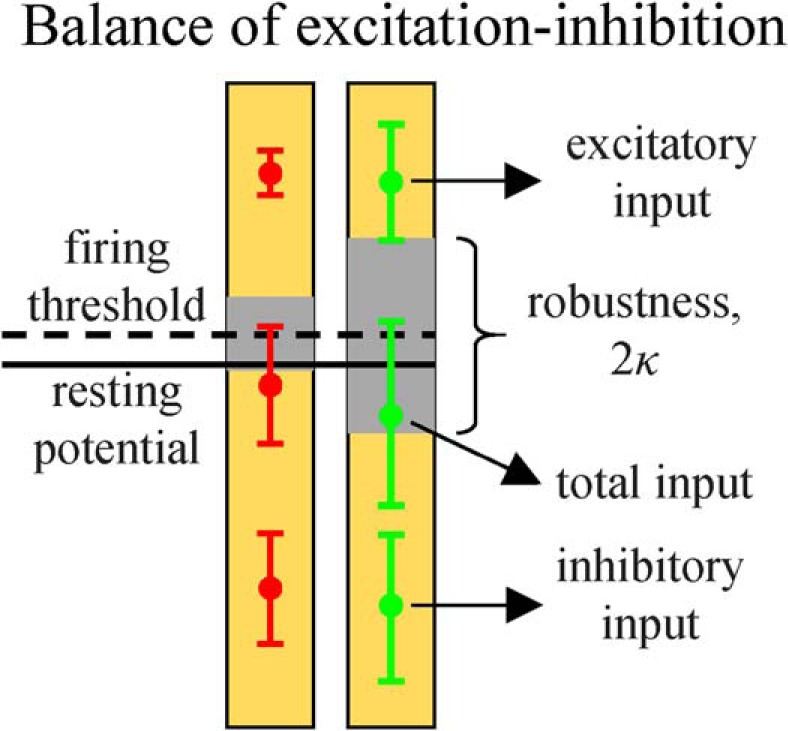
Figure 10.

Excitatory and inhibitory inputs in relation to the firing threshold and robustness. Left and right halves of the figure are based on the data from Table 1 and correspond to the red and green asterisks from Figure 4. The average excitatory and inhibitory inputs are much larger than the threshold of firing. However, the total input lies within 1 SD from the firing threshold due to a partial cancellation of its excitatory and inhibitory components.
