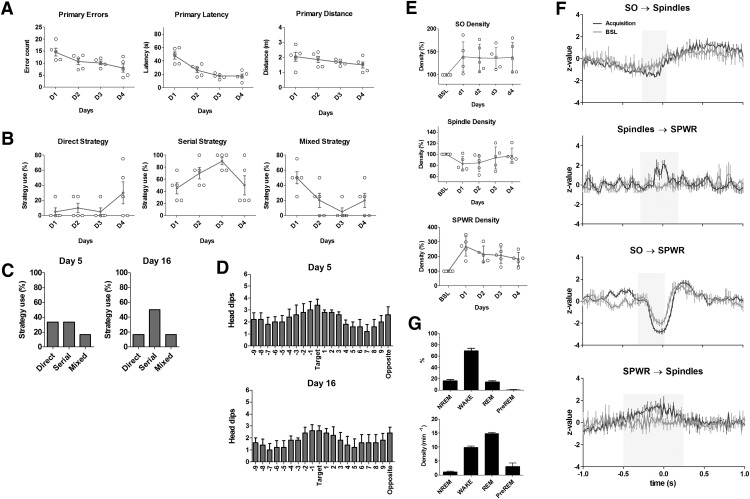
Figure 10.
Optogenetic inhibition during wakefulness and REM sleep (WRO-CTRL group). A–D, Barnes maze performance. A, Left to right, Time course across acquisition Days 1–4 (D1–D4) with 4 trials/d, of primary errors, primary latency, and primary distance for the WRO-CTRL. Gray symbols, Mean ± SEM; open circles, individual animals. B, Percentage of behavioral trials indicating use of direct, serial or mixed strategy for the WRO-CTRL on acquisition Days 1–4. Gray symbols, Mean ± SEM; open circles, individual animals. C, Percentage of behavior indicating use of direct, serial, or mixed strategy for the WRO-CTRL on probe Days 5 and 16. D, Mean number of head dips into each hole on Day 5 (top) and Day 16 (bottom) for the WRO-CTRL. Error bars indicate SEM. E, SO (top), spindle (middle), and SPWR (bottom) densities in IL during post-learning NREM sleep of acquisition Days 1–4 compared with BSL. Gray symbols, Mean ± SEM; open circles, individual animals. F, Event correlation histograms of SO, spindles, and SPWR during BSL and Barnes maze acquisition for the WRO-CTRL. For detailed explanation of axes and symbols, see Figure 6. G, Distribution of laser pulses across the 3 h recording period for the WRO-CTRL group. Left, Mean percentage of laser pulses of Days 1–4 during the different sleep stages. Right, Mean density of laser pulses of Days 1–4 during the different vigilant states. Error bars indicate SEM. For all graphs, N = 5.

