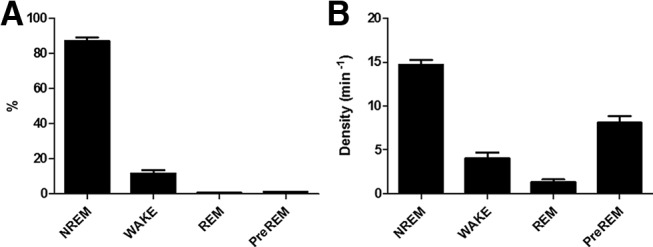
Figure 8.

Distribution of laser pulses across the 3 h recording period in the OPTO. A, Mean percentage of laser pulses of Days 1–4 during the different sleep stages. B, Mean density of laser pulses of Days 1–4 during the different vigilant states. N = 10. Error bars indicate SEM.
