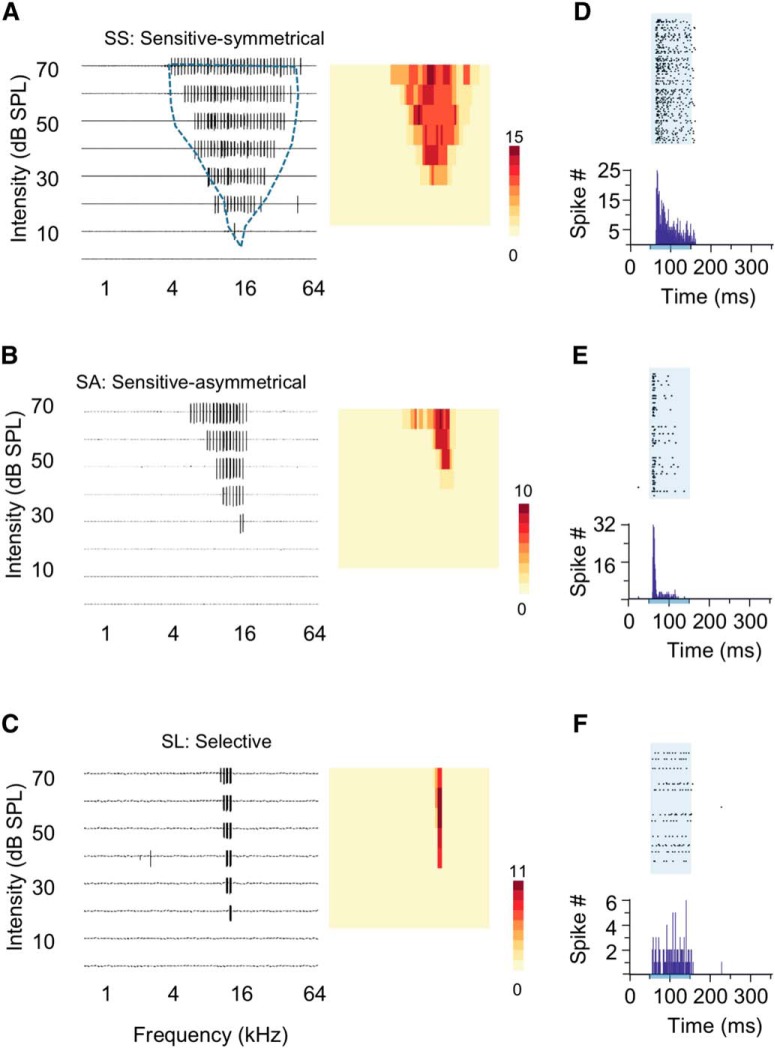
Figure 3.
Diverse spike TRFs of single neurons from in vivo cell-attached recordings in the CNIC. A–C, Three types of spike TRFs with similar CFs at 16 kHz and locations (∼50 μm distance to each other). Each panel represents 568 individual recording traces of 300 ms after tone onset; each trace represents a 300 ms recording of spike response after the onset of a tone stimulus with a particular combination of sound intensity (0–70 dB SPL) and frequency (0.5–64 kHz). Blue dashed contour delineates the spike TRFs of multiunit activities near these neurons in A–C. Insets, Color maps indicate spike numbers evoked by different tones within TRFs for SS neurons (A), SA neurons (B), and SL neurons (C). D–F, Raster plots and peristimulus time histograms (PSTHs) of the spike responses extracted from recordings in A–C. Each raster plots include 568 trials of 350 ms recordings including a 50 ms time window before the stimulus onset. Shaded areas and bars below PSTHs indicate stimulus onset and duration.

