Figure 8.
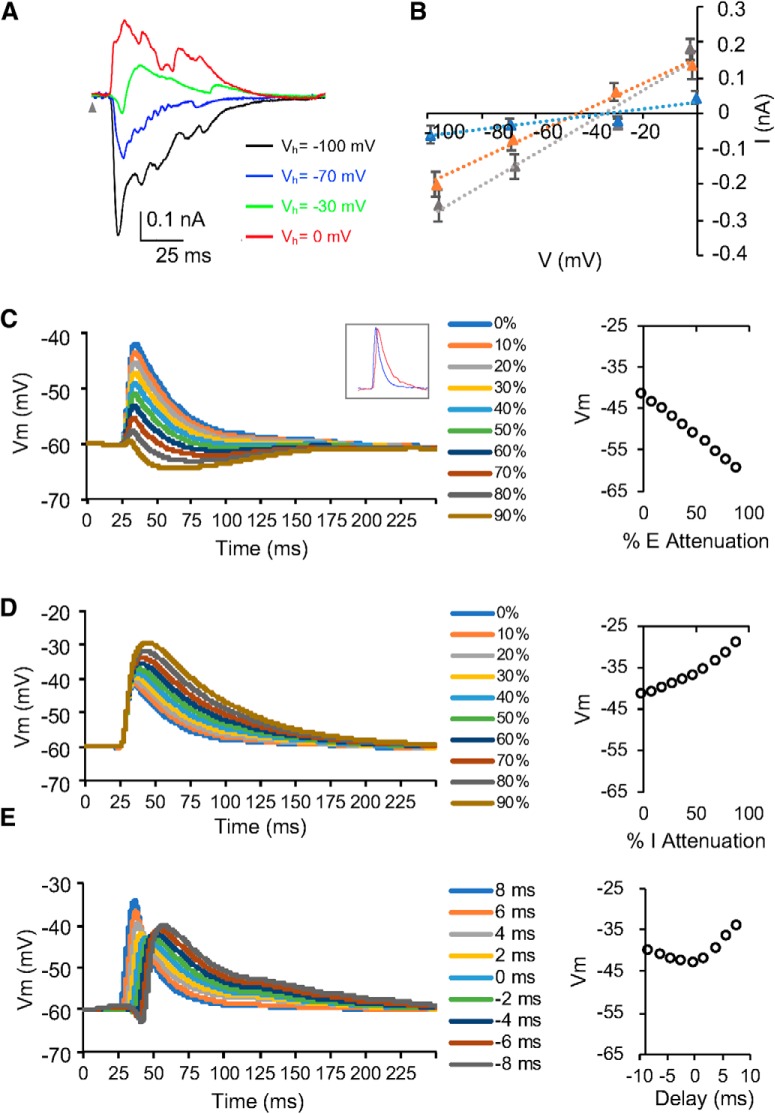
The effects of synaptic currents attenuated by space-clamping errors on membrane potential responses. A, Synaptic currents evoked by CF tones (16 kHz) at 60 dB SPL when the membrane potential of the example SS neuron was clamped at different holding voltages. Gray arrowhead indicates tone onset. B, I–V relationships for the three neurons in Figure 5A–F. I–V curves for synaptic currents averaged within a time window between 13 and 15 ms after the stimulus onset. M ± SD. SS, Gray; SA, blue; SL: orange. C, Simulated membrane potential responses when excitatory inputs were attenuated by 10–90%. Data point at 0% indicates simulation from non-attenuated synaptic inputs. Inset, Non-attenuated EPSC (blue) and IPSC (red) used in simulation. D, Simulated membrane potential responses when inhibitory inputs were attenuated by 10–90%. Data point at 0% indicates simulation from non-attenuated synaptic inputs. E, Simulated membrane potential responses when the relative latency between excitatory and inhibitory inputs were adjusted between −8 and 8 ms (inhibitory − excitatory, negativity indicates leading inhibition).

