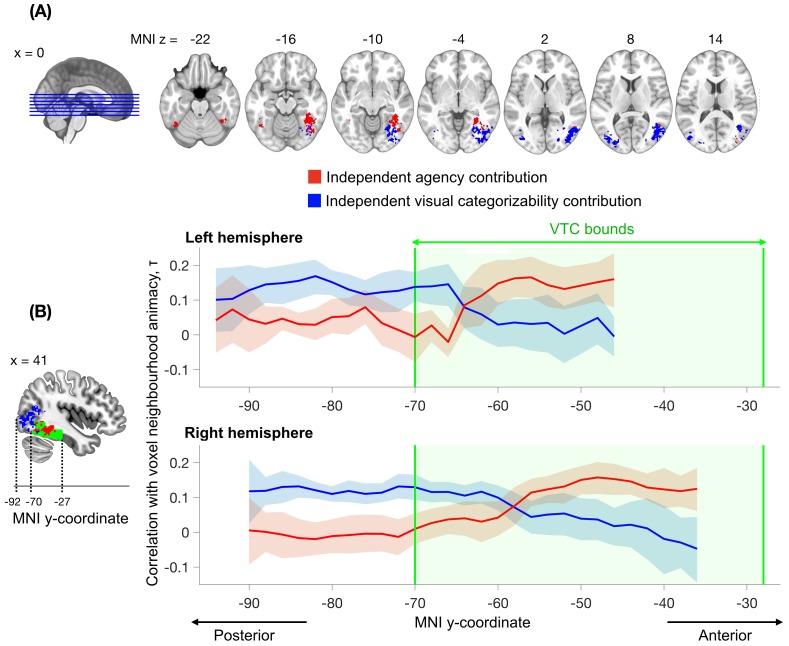
Figure 5. Searchlight analysis testing for the independent contributions of agency and visual categorizability to the animacy continuum.
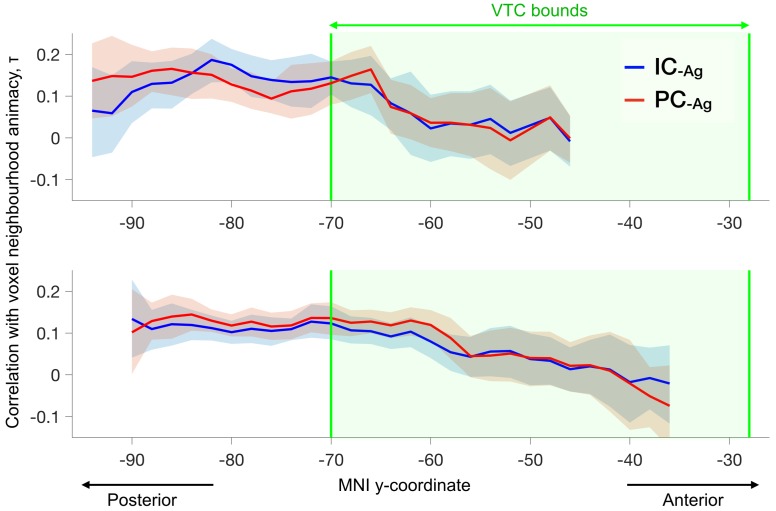
The analysis followed the approach performed within the VTC ROI (Figure 4C, middle panel) but now separately for individual spheres (100 voxels). The independent contribution of agency is observed within anterior VTC, while the independent contribution of visual categorizability extends from posterior VTC into the lateral occipital regions. Results are corrected for multiple comparisons (Materials and methods). (B) The correlations between agency and the animacy continuum in the searchlight spheres (variance independent of visual categorizability, in red) and the mean of the correlations between image and perceptual categorizabilities and the animacy continuum in the searchlight spheres (variance independent of agency, in blue), are shown as a function of the MNI y-coordinate. For each participant, the correlations are averaged across x and z dimensions for all the searchlight spheres that survived multiple comparison correction in the searchlight analysis depicted in (A). The blue and red bounds around the means reflect the 95% confidence bounds of the average correlations across participants. The green area denotes the anatomical bounds of VTC. Visual categorizability contributes more than agency to the animacy organization in the spheres in posterior VTC. This difference in contribution switches within VTC and agency contributes maximally to the animacy organization in more anterior regions of VTC.


