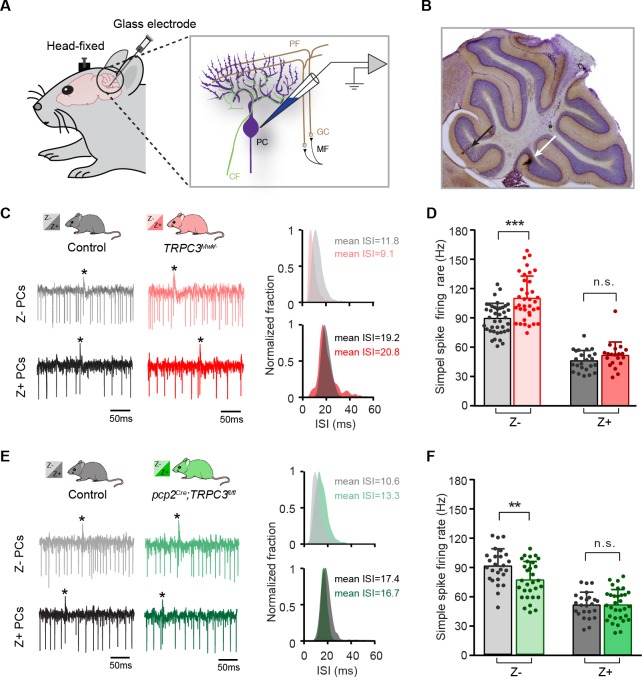
Figure 3. TRPC3 contributes to the in vivo simple spike firing rate of Z–, but not Z+ PCs.
(A) Schematic illustration of extracellular recording configuration in vivo. PF, parallel fiber; CF, climbing fiber; MF, mossy fiber; GC, granule cell. (B) Representative sagittal cerebellar section with recording sites labeled by BDA injection, in lobule II (black arrow) and X (white arrow). (C) Representative example traces (left) and ISI distributions (right) of a Z– PC (top) and a Z+ PC (bottom) in gain-of-function TRPC3Mwk/- mice. (D) PC simple spike firing rate recorded in vivo in TRPC3Mwk/- mice compared to control littermates, for the Z–lobules I-III (light-red, n = 36/N = 7 mutants vs. n = 40/N = 6 controls, t60 = −4.58, p<0.001) and the Z+ lobule X (dark-red, n = 20/N = 6 mutants vs. n = 24/N = 5 controls, t42=-1.47, p=0.148). (E) Representative example traces (left) and ISI distributions (right) in a Z– PC (top) and a Z+ PC (bottom) of loss-of-function pcp2Cre;TRPC3fl/fl mice. (F) PC simple spike firing rate of pcp2Cre;TRPC3fl/fl mice compared to controls, for Z– lobules I-III (light-green, n = 30/N = 7 mutants vs. n = 26/N = 8 controls, t54=2.88, p=0.006) and in Z+ lobule X (dark-green, n = 32/N = 8 mutants vs. n = 24/N = 6 controls, t54 = −0.053, p=0.958). Data are represented as mean ± s.d., for values see Source data, ** means p<0.01 and ***p<0.001.


