. 2019 Sep 9;8:e48417. doi: 10.7554/eLife.48417

Figure 1. Electrophysiology of adult human pyramidal neurons.

(A) Example of biocytin filled pyramidal neuron (14 DIV) after streptavidin-Cy3 counterstaining, scale bar 150 µm. (B) Typical regular spiking pattern of human pyramidal neurons (acute slice, 3 DIV and 13 DIV) in response to +200 pA positive current injection. (C) Neurons recorded in acute slices (within 12 hr after surgery) and in brain slice cultures (2–3 DIV and 7–14 DIV) showed similar action potential firing frequencies and typical spike frequency adaptation upon 200 pA current injection. (D, E) Quantification of (from left to right) the AP half width, resting membrane potential, sag potential amplitude and input resistance revealed no significant correlation between these values and the days in vitro (DIV), (E) except membrane resting potential which slightly changed to more depolarized values within the first 2–3 days in culture and then stayed stable over the remaining time.

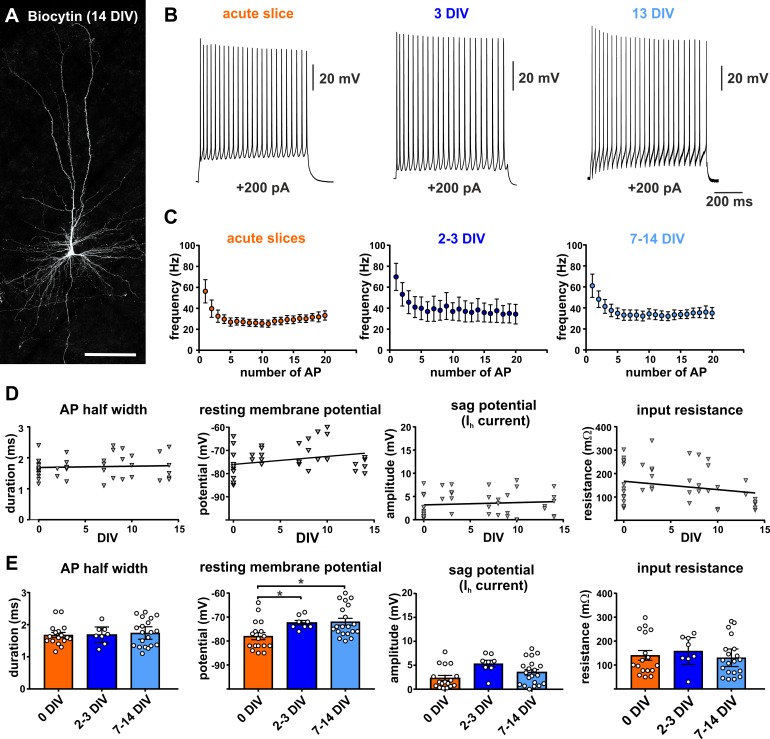
Figure 1.

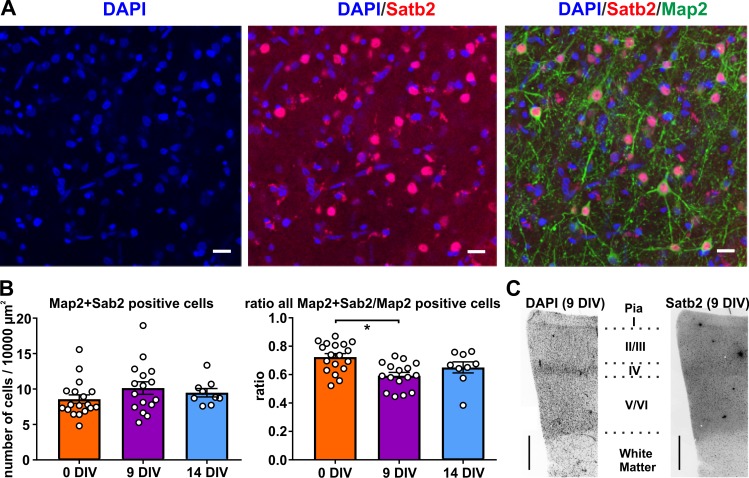
Figure 1—figure supplement 1. Satb2 positive neurons in human brain slice cultures.

Figure 1—figure supplement 1.

(A) High-resolution image of a confocal z-stack collapsed into one optical plane processed for ICC of the glutamatergic neuronal marker Satb2 and neuron-specific cytoskeletal protein Map2 in layers 2/3, scale bar 20 µm. (B) Quantification of Map2/Satb2 double positive neurons normalized to 100 µm x 100 µm areas and the plot of the ratio of Map2+Satb2/Map2 positive cells. (C) The slices contained all six cortical layers, shown are representative examples with staining for DAPI and Satb2, scale bar 500 µm.
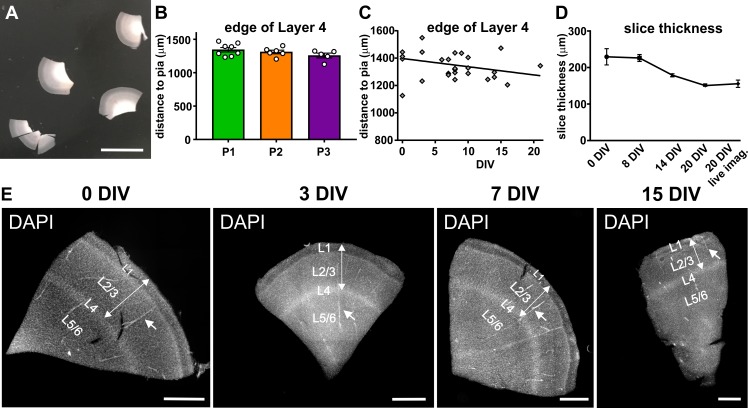
Figure 1—figure supplement 2. Stability of gross structural features of cortical slices between surgeries and over time in culture.

Figure 1—figure supplement 2.

(A) On the day of the surgery slices are prepared from tissue blocks and carefully cut into even slices containing all six layers, scale bar 1 cm. (B) Comparison of slices originating from three independent surgeries of temporal cortex (P1-3) show a comparable distance from pia to the edge of layer 4, which was clearly visible upon DAPI staining. (C) This distance did not change significantly over time in culture up to the endpoint of analysis at 20 DIV. (D) Slice thickness slightly decreased throughout the analyzed three-week period in culture. (E) Examples of DAPI stainings of slices of the same surgery at different time points in culture (0 DIV - 15 DIV). Cortical thickness from pia to the edge of layer 4 (double arrow). Note blood vessels (arrows) running parallel to the slicing plane, indicating that sections indeed were prepared perpendicular to the cortical surface, scale bar 1000 µm.