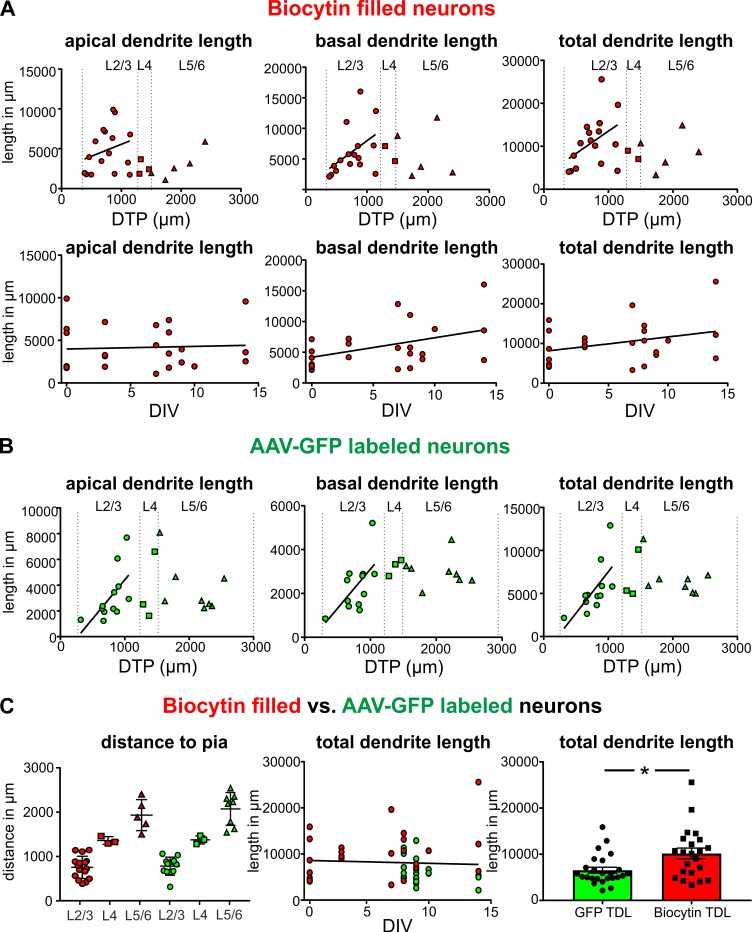
Figure 5. Quantification of the total length of apical and basal dendrites of biocytin filled and GFP-labeled neurons.
(A) Upper panels: Neurons that were patched and filled in layers 2/3 are represented by red circles, neurons in layer four by red squares and neurons in layers 5/6 by red upward triangles. Bottom panels: Each biocytin filled neuron is represented by a red circle. (B) GFP-labeled layers 2/3 neurons are represented by green circles, neurons in layer four by green squares and neurons in layers 5/6 by green upward triangles. (C) Left: Analysis of the distribution of biocytin filled (red) and GFP-labeled (green) pyramidal neurons in the different layers. (C) Middle: Total dendritic length of biocytin filled (red) and GFP-labeled (green) pyramidal neurons plotted against DIV. (C) Right: Reconstructions of pyramidal neurons based on GFP expression slightly underestimated the total dendritic length compared to classic biocytin fillings (n = 22 for biocytin, n = 23 for GFP-labeled, **p<0.01).

