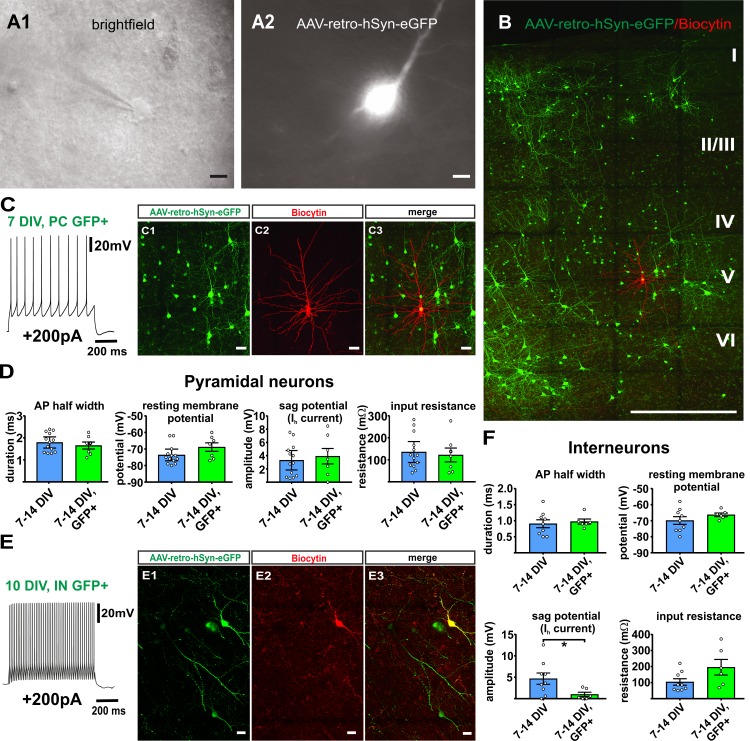
Figure 8. Virally transduced neurons show no major changes of basic properties.
(A) GFP positive neurons were visualized according to their GFP fluorescence (A2) and targeted for whole-cell patch clamp recordings (A1), scale bars 10µm. (B) Overview image of a double positive pyramidal neuron (GFP and Biocytin) after whole cell recording and post-hoc staining, scale bar 500 µm; (C1–C3) and in detail, scale bar 20 µm. (C) Example of a representative regular firing pattern of a GFP positive pyramidal neuron (+200 pA). (D) Quantification of basic properties of GFP negative and GFP positive human pyramidal neurons. (E) Example of a GFP positive fast spiking interneuron. (E1-E3) GFP signal, biocytin filling and merge of the same neuron, scale bar 20 µm. (F) Quantification of basic properties of GFP negative and GFP positive human interneurons, *p<0.05, Mann Whitney test.

