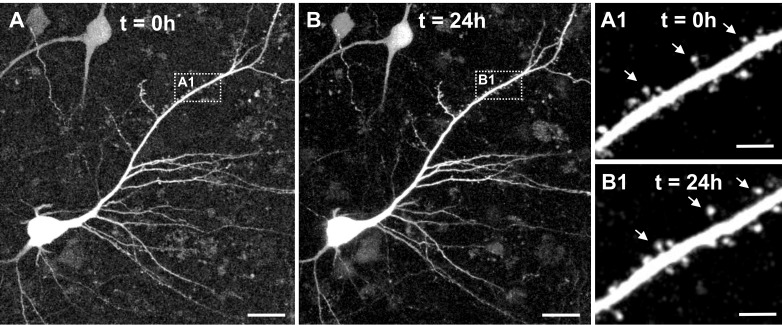
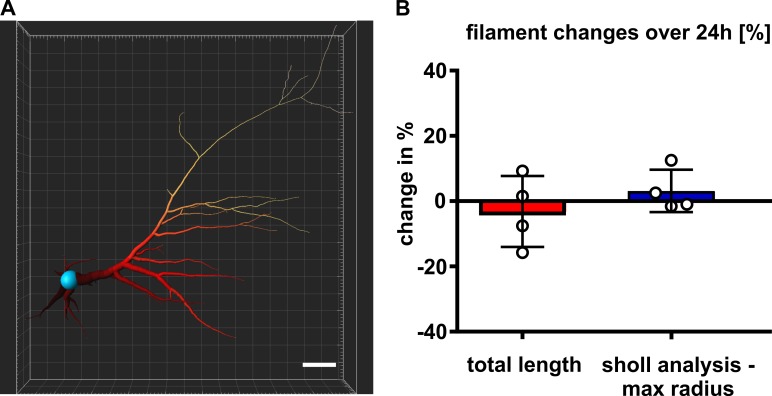
Figure 9. Two-photon live imaging of human neurons over 24 hr.
(A) Maximum projection of a GFP positive human pyramidal neuron in slice culture at the start of the measurement and (B) after 24 hr life cell imaging with acquisition of image stacks every 30 min. (A1) and (B1) inserts are zoomed in images of the same branch of the apical dendrite at 0 and 24 hr of imaging. Arrows point to the same spines. Scale bars 20 µm (A, B) and 5 µm (A1, B1).


