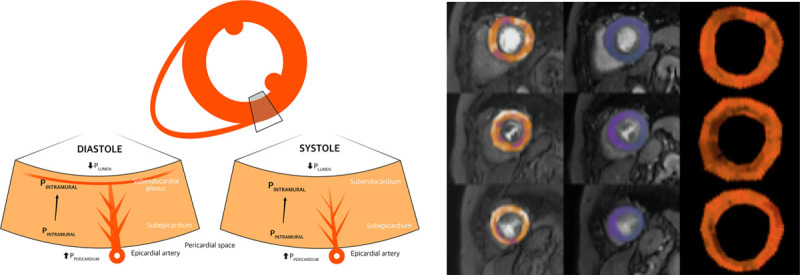
Figure 2.

Structural and functional coronary and myocardial changes during the cardiac cycle and vasodilator stress. A, Diagrammatic representation of the extravascular forces and intraluminal pressures affecting myocardial layers, demonstrating greater subendocardial contraction during systole. B, Perfusion quantification map in a patient with AS (rows from top to bottom are basal, mid, and apical slices, respectively, with stress, rest, and myocardial perfusion reserve [MPR] in columns left to right). Global endocardial-epicardial gradient 0.9, MPR 2.0. PINTRAMURAL indicates intramural pressure; PLUMEN, pressure in the left ventricular lumen; and PPERICARDIUM, pressure in the pericardial space. Adapted from Duncker and Bache and Bell and Fox25,26 with permission. Copyright ©2008, The American Physiological Society.
