
Table 1.
Correlation of angle alignment with circumferential direction (gel geometry)
| A. Edge samples from detached gels | B. Calculated mean direction
|
C. Corresponding circumferential θ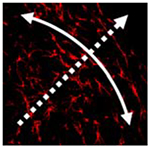
|
D. Correlation coefficient between columns B and C |
|---|---|---|---|
| 4 h | |||
| 1 | 6.69 | 0 | |
| 2 | −24.46 | 90 | |
| 3 | 23.43 | 45 | |
| 4 | 87.34 | 90 | |
| 5 | −8.51 | 0 | |
| 6 | −47.82 | −45 | 0.76 |
| 8 h | |||
| 1 | −76.67 | −90 | |
| 2 | 68.18 | 45 | |
| 3 | −58.01 | −45 | |
| 4 | −30.91 | −45 | |
| 5 | 78.39 | 90 | |
| 6 | 53.4 | 45 | 0.98 |
| 12 h | |||
| 1 | −51.34 | −45 | |
| 2 | −55.14 | −45 | |
| 3 | −62.22 | −90 | |
| 4 | 89.98 | 90 | |
| 5 | −72.42 | −67.5 | |
| 6 | −72.42 | −22.5 | 0.92 |
| 24 h | |||
| 1 | −76.54 | −90 | |
| 2 | −54.19 | −90 | |
| 3 | −53.3 | −45 | |
| 4 | 3.89 | 0 | |
| 5 | 54.2 | 45 | |
| 6 | 58.98 | 67.5 | 0.97 |
Note: Based on the mean alignment direction of six samples from each time point (data are representative of n = 4, 2–3 images per gel.), statistical correlations coefficients were calculated of cellular alignment with circumferential (gel perimeter) direction along gel edge. A value of 1 is perfect positive correlation, 0 indicates uncorrelated