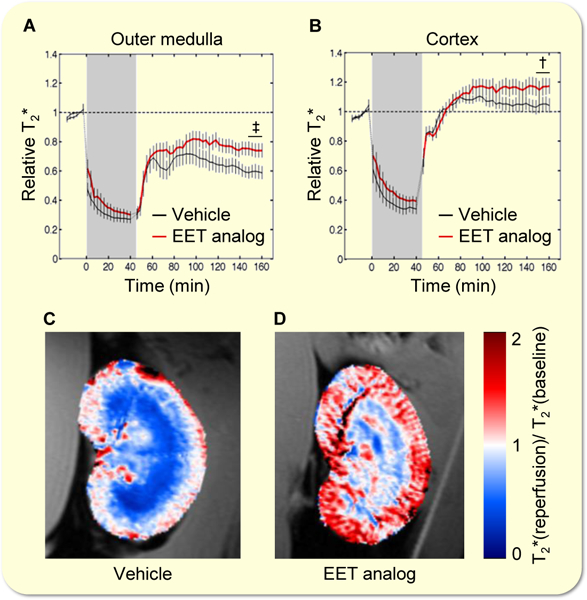
Figure 5: EET analog improves intrarenal oxygenation measured by high temporal resolution parametric MRI during the initial I/R phase.

Kinetics of T2* changes (a, b) and color-coded T2* ratio maps (reperfusion/baseline) of two exemplary kidneys superimposed to the anatomical MR image (c, d) show lower extent of hypoxia and better reoxygenation after EET analog treatment. Data are given as mean ± SEM (n = 7–10 per group). Statistically significant differences (2-tailed t-test) were observed as indicated: †(p<0.01) and ‡(p<0.001) vs. vehicle.
