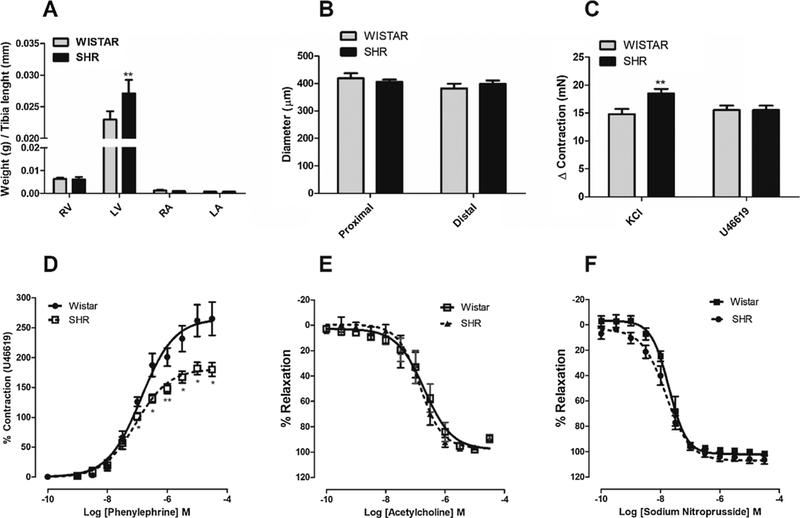
Fig. 5. Vascular abnormalities in IPA from hypertensive compared to normotensive rats.

A. Bar graph summary showing weights of the right atrium (RA), left atrium (LA), right ventricle (RV) and left ventricle (LV) from Wistar and SHR (n = 6 each group). Data are mean tissue weight/tibia length (mm). B. Bar graph showing the proximal or distal internal pudendal arteries diameters (μm) predicted from arterial normalization curve. C. Bar graph showing the level of contraction (mN) induced by KCl (60mM) and U46619 (10−6 M) in IPA with functional endothelium, from SHR and Wistar rats (n = 19). Concentration-response curves to Phenylephrine (D), acetylcholine (E) and SNP (F) were performed in the IPA with functional endothelium from SHR and Wistar rats (n = 8 and 9, respectively). Data are the mean ± SEM. The data were examined using unpaired Student’s t tests. *p < 0.05 vs Wistar.
