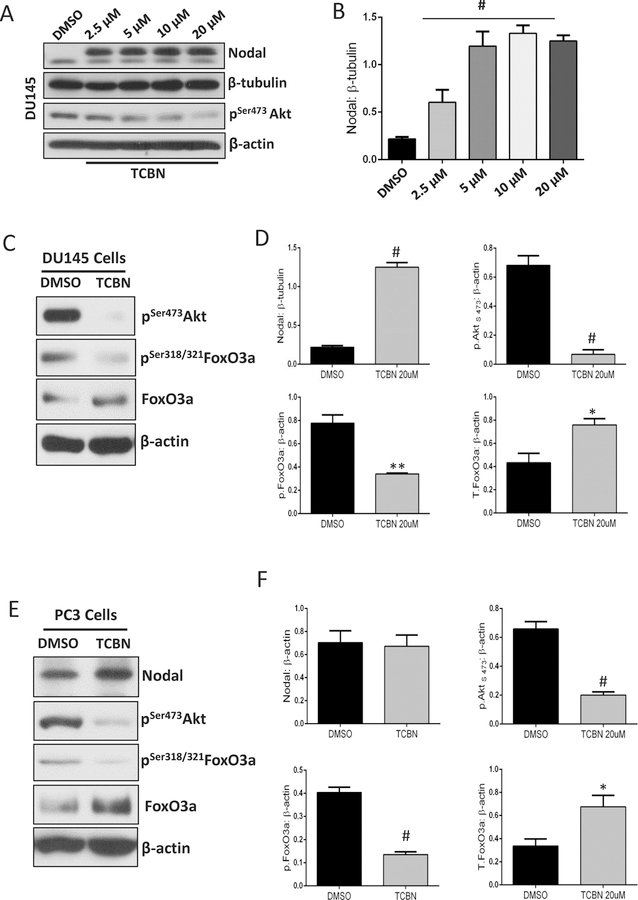
Figure 2. Pharmacological inhibition of Akt1 activated FoxO1/3a and promotes Nodal expression in PCa cells.
(A-B) Representative Western blot images and respective bar graph of band densitometry analysis on the effect of Akt inhibitor TCBN treatment (72 hours) on Nodal expression in DU145 cells (n=3). (C-D) Representative Western blot images and respective bar graph of band densitometry analysis on the effect of Akt inhibitor TCBN treatment (72 hours) on phosphorylation and total expression of FoxO3a in DU145 cells (n=3). (E-F) Representative Western blot images and respective bar graph of band densitometry analysis on the effect of Akt inhibitor TCBN treatment (72 hours) on phosphorylation and total expression of FoxO3a as well as Nodal in PC3 cells (n=3). Data are presented as mean ± SEM. *p<0.05; **p<0.01; #p<0.001.

