Fig. 1.
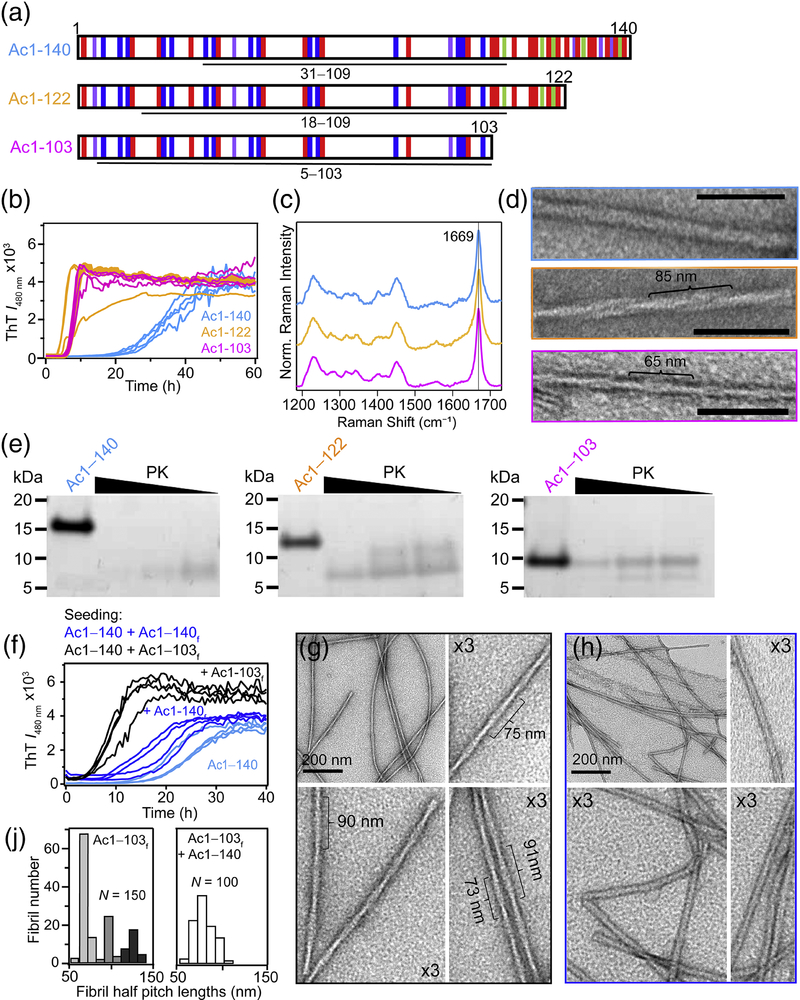
Structural characterization and aggregation of C-terminal α-syn truncations. (A) Schematic representation of the primary amino acid sequence of Ac1–140, Ac1–122 and Ac1–103 showing basic (blue), acidic (red), aromatic (purple) and proline (green) residues. Underline regions correspond to PK-resistant cores determined by LC-MS (Supplemental Table S1). (B) Aggregation kinetics monitored by ThT ([α-syn] = 50 μM and [ThT] = 10 μM in 10 mM NaPi, 140 mM NaCl, pH 7.4, 37 °C, λex = 440 nm and λobs = 480 nm). (C) Raman spectra showing the characteristic amide-I band (1669 cm−1) for β-sheet. (D) Representative TEM images. Estimated helical half pitch (defined as a 180° helical turn) is ~85 and ~65 nm for Ac1–122 and Ac1–103. Ac1–140 could not be determined. Scale bar is 100 nm. (E) Limited protease digestions of α-syn fibrils (40 μM) with decreasing PK (4, 0.8, and 0.4 ng for 20 h at 37 °C) visualized by SDS-PAGE. (F) Seeding reactions of Ac1–140 (50 μM) in the absence and in the presence of 5% Ac1–140 or Ac1–103 fibrils monitored by ThT (same conditions as panel B). TEM images of Acl–140 seeded with (G) Ac1–103 or (H) Ac1–140 fibrils. (J) Histograms of measured half pitch lengths from Ac1–103 fibrils (left) (N = 150) and Ac1–140 seeded with Ac1–103 fibrils (right, N = 100). The subscript f denotes fibrils.

