Fig. 2.
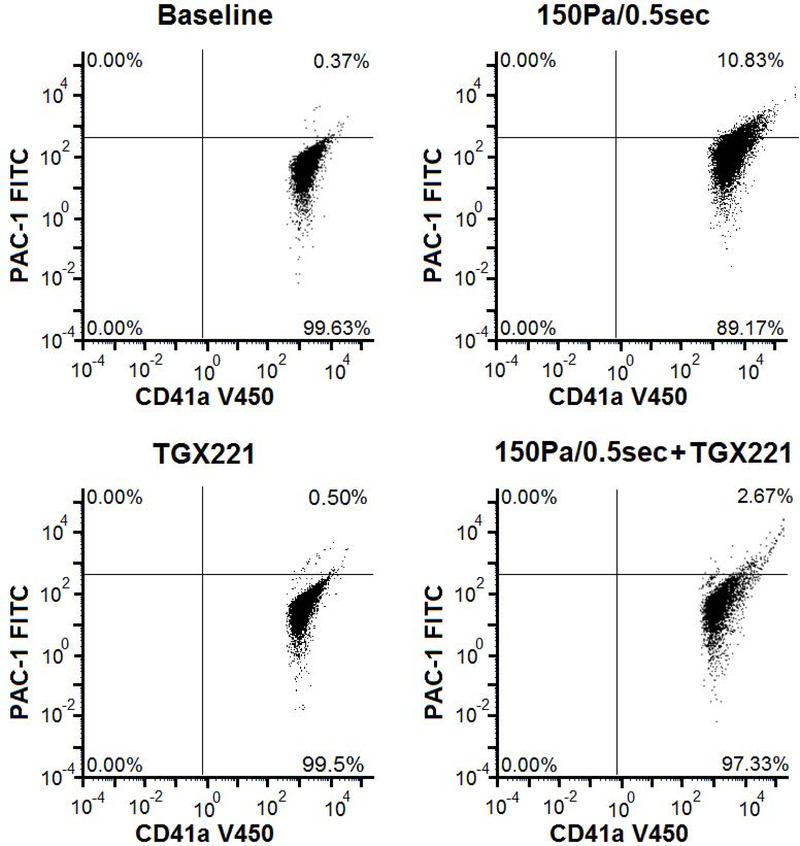
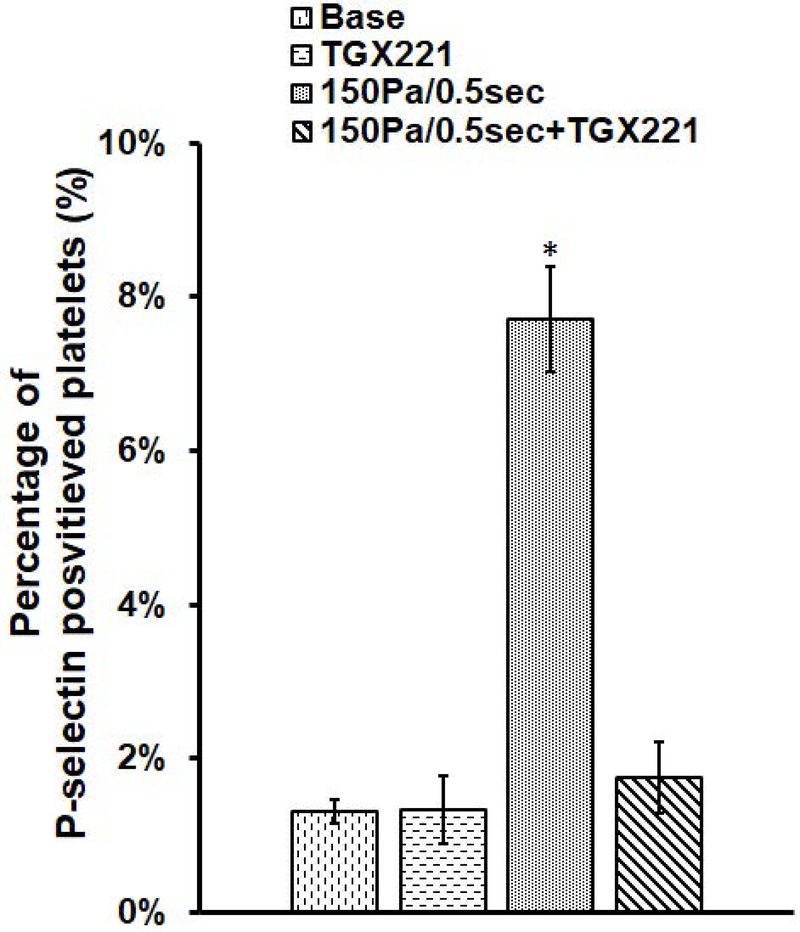
The comparison of platelet activation in (1) baseline (untreated and unsheared) platelets, (2) TGX221 treated (2.2 μM) + unsheared platelets, (3) untreated + NPSS sheared (150 Pa/0.5 sec) platelets, and (4) TGX221 (2.2 μM) treated + NPSS sheared (150 Pa/0.5 sec) platelets. A) Typical images of flow cytometry fluorescence intensity dot plots of platelets; B) Average percentages of platelets with GPIIb/IIIa activation; C) Average percentages of platelets with P-selectin expression; (n=8, *P < 0.05)


